
Data quality metrics should tell you whether the business can rely on its data for a particular decision. A dashboard full of passing checks can still leave that question unanswered.
Imagine a billing team receiving 990 usage records. Every record has the required fields, a valid customer identifier and a nonnegative quantity. The checks look excellent. But the source recorded 1,000 distinct billable events. The delivery contains only 985 distinct identifiers, with five repeated rows. Fifteen events never arrived.
That is a fictional teaching scenario, not an observed company result. It illustrates the distinction I care about as a data leader: measuring the condition of delivered records and measuring whether the business received the information it needed.
My view is that a useful quality scorecard starts with the decision, the data population and the consequence of being wrong. Otherwise, teams can spend months improving a percentage that nobody knows how to use.
What are data quality metrics?
Data quality metrics are measurements of whether data meets defined requirements for its intended use. They can quantify missing values, duplicate records, freshness, rule violations, disagreement between systems and accuracy against suitable evidence. Each metric needs a defined population, calculation, review point and response when its result is unacceptable.
A dimension describes an attribute such as completeness. To measure it, a team might calculate the percentage of expected billable events received before the billing cutoff. The threshold defines the accepted result. Finally, the response explains what happens when the result falls below that threshold.
This distinction prevents a familiar problem: six useful words on a slide, followed by six percentages whose denominators nobody can explain.
In the fictional manufacturing story in AI to ROI for Business Leaders, the team encounters different numbers for orders, shipments and invoices. Those figures can disagree because they describe different business events. A quality discussion has to settle what is being measured before treating disagreement as an error.
Which data quality metrics should leaders track?
Start with the quality measures that could change the decision your dataset supports. Common dimensions include completeness, validity, uniqueness, freshness, consistency and accuracy, but their priority depends on the workflow. Billing needs evidence about missing or repeated charges; an inventory decision may depend more immediately on stock freshness and units.
| Dimension | Useful measurement | Business example | What it cannot prove alone |
|---|---|---|---|
| Completeness | Required fields populated; expected events received | Did every billable event reach billing? | Populated fields do not prove the delivery is complete |
| Validity | Records satisfying an explicit format, range or domain rule | Is usage a nonnegative integer in the agreed unit? | A plausible quantity can still be wrong |
| Uniqueness | Excess occurrences of the agreed business key | Was one request delivered twice? | Unique identifiers do not prove correct customer attribution |
| Freshness | Age or delivery delay against an agreed time requirement | Is the stock position current enough to promise delivery? | A recent timestamp does not prove every source contributed |
| Consistency | Comparable values agreeing across aligned sources | Do billing and the source ledger agree for the same event? | Two sources can inherit the same error |
| Accuracy | Values verified against trustworthy evidence | Does the usage belong to this customer? | Accuracy for inspected records does not establish accuracy everywhere |
I would also track the operating consequences: how long a consequential defect remained undetected, how long recovery took, and whether the same failure recurred. These describe how the team handles quality problems. They should sit beside the data measurements, with their own definitions.
Keep this separate from measuring the business value of the data team. Quality is one contributor to that value. It is not a substitute for measuring whether the business outcome improved.
How do you calculate data quality metrics without misleading yourself?
Define the record grain, eligible population, time window, exclusions and evidence before calculating a rate. Use the population relevant to the question: delivered records for field checks, expected distinct events for delivery coverage, and inspected records for sample accuracy. Report counts alongside percentages and keep missing evidence separate from a passing result.
For example, in the billing scenario, one event identifier represents one metered request. The incoming table has one row per delivery occurrence, so retries can create repeated identifiers. The expected ledger has one row per billable event in the same closed window. A customer reference has one row per customer, joined through customer_id.
First, before comparing the two event populations, the owner has to agree on the cutoff and treatment of late arrivals, cancellations and test requests. A feed covering yesterday cannot be reconciled honestly against a ledger covering the whole week.
Calculations and their limits
| Metric | Calculation | Important definition |
|---|---|---|
| Required-field completeness | Delivered rows with every named required field populated / delivered rows × 100 | Specify the fields and treat blank strings explicitly |
| Expected-event coverage | Distinct expected event IDs found in delivery / distinct expected event IDs × 100 | Unexpected IDs cannot improve coverage |
| Excess duplicate rate | (Delivered rows − distinct nonblank event IDs) / delivered rows × 100 | Use after confirming keys are populated; this counts excess copies |
| Rule pass rate | Eligible rows passing one named rule / rows evaluated by that rule × 100 | A percentage applies only to that rule and population |
| Freshness lag | Observation time − latest relevant source event time | Use an agreed timezone and inspect important partitions separately |
| Sample accuracy | Inspected records confirmed correct / inspected records × 100 | Explain selection and evidence; do not extrapolate casually |
However, the duplicate formula is one definition, not the only possible one. A team might instead count every row belonging to a duplicated key. Both can be useful, but they produce different percentages. Label the measure so readers can reproduce it.
Similarly, if the denominator is zero, show “not evaluated” and explain why. If an expected feed never arrived, its absence needs a delivery alert. It does not become a successful field-validation run because there were no bad rows to inspect.
Why can all the checks pass while the business numbers are wrong?
Checks can pass because they test only particular conditions on the evidence available to them. A valid customer can be the wrong customer, a permitted quantity can represent the wrong unit, and every delivered row can be valid while expected rows are absent. Passing results establish compliance with those checks, not universal correctness.
Now return to the fictional delivery. All 990 rows pass the configured required-field, customer-reference and quantity checks. However, an additional identity comparison finds 985 expected identifiers, five excess copies and 15 missing identifiers. There are no unexpected identifiers in this example.
The same delivery, different measurements
| Measure | Worked result | Interpretation |
|---|---|---|
| Required-field completeness | 990 / 990 = 100% | Every delivered row has the named fields |
| Nonnegative-integer quantity pass rate | 990 / 990 = 100% | The delivered quantities satisfy this rule |
| Customer-reference pass rate | 990 / 990 = 100% | The customer identifiers exist in the reference |
| Expected-event coverage | 985 / 1,000 = 98.50% | 15 expected events are absent |
| Excess duplicate rate | 5 / 990 = 0.51% | Five delivery occurrences repeat identifiers |
| Accuracy against source evidence | Not evaluated | The row checks do not establish measured quantities or attribution |
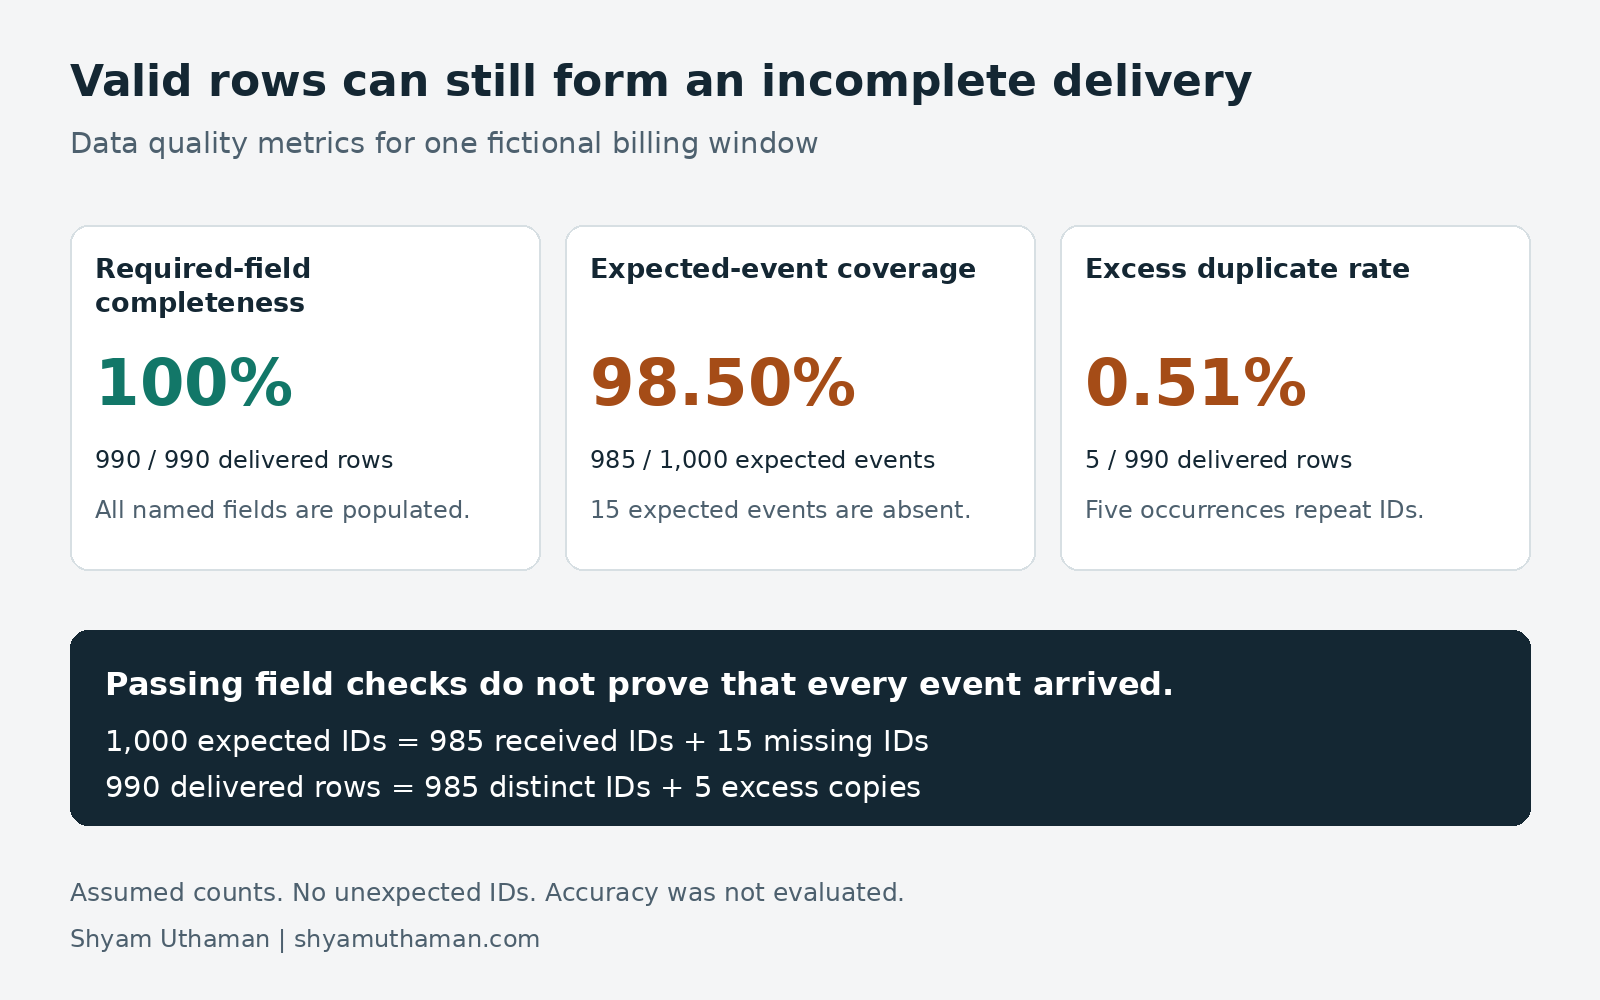
What the passing checks leave unanswered
Even so, it would be tempting to average the percentages into a single health score. I would resist that for billing. A high average can conceal a failure that should stop the release, and these measures describe different populations rather than interchangeable evidence.
My published data contract validation experiment demonstrates the same limit on a smaller controlled fixture. Its contract gate blocked eight of 11 deliberately defective batches, but three incorrect billing outcomes passed. Missing usage, wrong customer attribution and an undisclosed measurement change remained outside the gate’s evidence. Those results describe the selected cases, not a general detection rate.
That is why a data contract should describe the completeness and reconciliation expectations as well as individual field rules. The measurements tell you how the implemented agreement behaved.
What belongs on a data quality dashboard?
A useful data quality dashboard connects each measurement to a dataset, business decision, current population, threshold, accountable role and required response. Show missing or stale evidence explicitly. Leaders need to see which decision is affected and who acts next, while engineers need access to the records and checks behind the summary.
In practice, for this billing delivery, my dashboard would show the closed billing window, 1,000 expected identifiers, 985 received identifiers, five excess copies, unresolved missing events and a release decision. An illustrative policy would hold the affected batch until the discrepancies were explained and corrected. That policy is a scenario choice, not a universal requirement.
However, a dollar figure should appear only after the affected events are mapped to applicable prices and customer terms. Fifteen missing events do not establish a particular revenue loss. Nor should missing charges and duplicate charges be allowed to cancel each other in a reassuring net total.
For example, one practical split is an executive view of affected decisions and unresolved exposure, backed by an engineering view of rule failures, event identifiers and lineage. Both should describe the same incident. A leader should not need to inspect every row, and an engineer should not have to infer the business consequence from a red box.
How should leaders choose data quality thresholds?
Choose thresholds from the consequence of using incorrect data, the decision deadline and the ability to recover. Customer billing, exploratory analysis and operational planning can justify different tolerances. Have the business owner approve consequential exceptions, and review thresholds when definitions, source behavior or the workflow changes.
For that reason, I would not start by declaring every dataset must be 99% complete. Missing an optional product description and missing a customer identifier on a charge have very different consequences. A tolerated defect should have a reason beyond “the dashboard would otherwise stay red.”
For exploratory analysis, the team may proceed with disclosed exclusions. For a delivery promise, stock age can determine whether the number is usable. For a billing run, unexplained missing or repeated events may justify holding publication. Define the action at the same time as the threshold.
Meanwhile, volume changes also need context. A holiday, launch or customer migration can alter a normal pattern. An anomaly alert identifies something to investigate; it does not, by itself, establish defective data.
Who should act when a data quality metric fails?
The producer should investigate defects in the data it supplies, the data team should preserve evidence and enforce agreed controls, and the business owner should decide consequential exceptions and recovery priorities. Assign named roles for detection, correction and release approval. Shared responsibility is useful only when each decision has a clear owner.
In the fictional billing scenario, the metering owner investigates absent events, the pipeline owner checks replay handling, and the billing owner decides whether to delay release or use an approved correction process. Human review is required for disputed attribution, unusual business behavior and exceptions that can affect customer charges.
As a result, a review should end with a recorded decision: what failed, which population was affected, what was held or corrected, who approved recovery, and what evidence supports the decision. Repeating an alert without changing the outcome is monitoring activity. It is not recovery.
How do you validate a data quality scorecard?
Validate a scorecard by independently checking its arithmetic, populations, exclusions and reference evidence, then testing whether a consequential defect triggers the intended response. Review both passing and failing cases. If the reference shares the same upstream mistake, matching results can still be wrong, so document what the evidence can and cannot establish.
The worked arithmetic here is deliberately inspectable: 985 distinct received events plus 15 missing events equals the 1,000-event expected population. The 985 distinct events plus five excess copies equals 990 delivered rows. These calculations are a teaching example, not a new production benchmark or a ChatGPT-versus-Claude test.
Beyond this example, I would also review period boundaries, retries, late events and reference changes. I would ask whether accuracy was measured for the full population, a justified sample or a convenient handful of records. The last option can find a problem, but it cannot support a confident accuracy claim.
Download the worked data quality scorecard
The reader package contains a blank CSV scorecard, the worked billing scorecard and instructions for defining each measure. The worked file is a static example, not a connected dashboard. The template records calculations, populations, evidence, thresholds, owners and release decisions; it does not automatically calculate rates.
Download the data quality metrics scorecard reader pack (ZIP)
To begin, start with one dataset used for a consequential decision. Agree on its grain and expected population, choose the measurements that expose a wrong decision, and rehearse what happens when one fails. Expand after you understand which gaps remain.
For the wider leadership questions about trustworthy information and ownership, see The Data-Driven Executive. For future practical experiments and business reviews, visit the AI executive toolkit signup page.
Official resources
- dbt data tests: implementing assertions such as uniqueness, nonnull values, accepted values and relationships.
- Databricks pipeline expectations: applying constraints and selecting retain, drop or fail behavior.
- Databricks pipeline event logs: inspecting the quality metrics recorded by supported pipeline operations.
These resources explain implementation options. The intended business use, evidence and exception policy still need agreement. This guide does not assume that every feature is available in a free workspace.
What are you building, what data does it depend on, and which blocker makes its numbers hardest to trust? Share your scenario in the comments.