
AI STRATEGY
Ninety days after an AI assistant goes live, the rollout report usually leads with one number: monthly active users. In the fictional 1,000-seat rollout I modeled for this article, that number was 61%. It looked like success. When I traced the same rollout down to the work it was bought to change, AI was used on 13% of eligible cases and overall handle time had fallen about 1.5%. Both numbers are true. Only one tells leaders whether the investment is working.
Short answer: the AI adoption metrics that matter after a pilot are repeat use, the share of eligible tasks done with AI, the rate at which outputs are accepted or overridden, quality against a comparison group, and the change in the business outcome the tool was meant to move. Licenses and logins only show reach.
My AI adoption playbook and AI change management guides cover how to get people using AI. This article covers how to tell whether it worked. The rollout, the funnel and every figure in it are illustrative. The metric definitions and the cadence are my judgment, checked against the measurement guidance Microsoft and GitHub publish for their own AI tools.
What are AI adoption metrics?
AI adoption metrics measure how far an AI tool has become part of real work. They run from reach, such as licenses and activation, through habit, such as repeat use, to workflow penetration and business outcome. Useful reporting shows every stage, because a rollout can look healthy at the top and change little at the bottom.
Vendor dashboards have grown more detailed. Microsoft’s Copilot Analytics documentation groups its reports into readiness, adoption, impact and business outcomes, and GitHub documents active users alongside code acceptance activity for Copilot. Those are useful sources of usage data. What they cannot know is which of your workflows the tool was bought to change, what those workflows cost before, or whether the result moved. That part is the organization’s job.
Why isn’t monthly active users enough to measure AI adoption?
As most dashboards define it, monthly active users counts anyone who used the tool at least once in 30 days. It treats a person who asked one question and a person who now handles every case with AI as the same. It also includes people outside the target workflow, so it can rise while the work the tool was bought for barely changes.
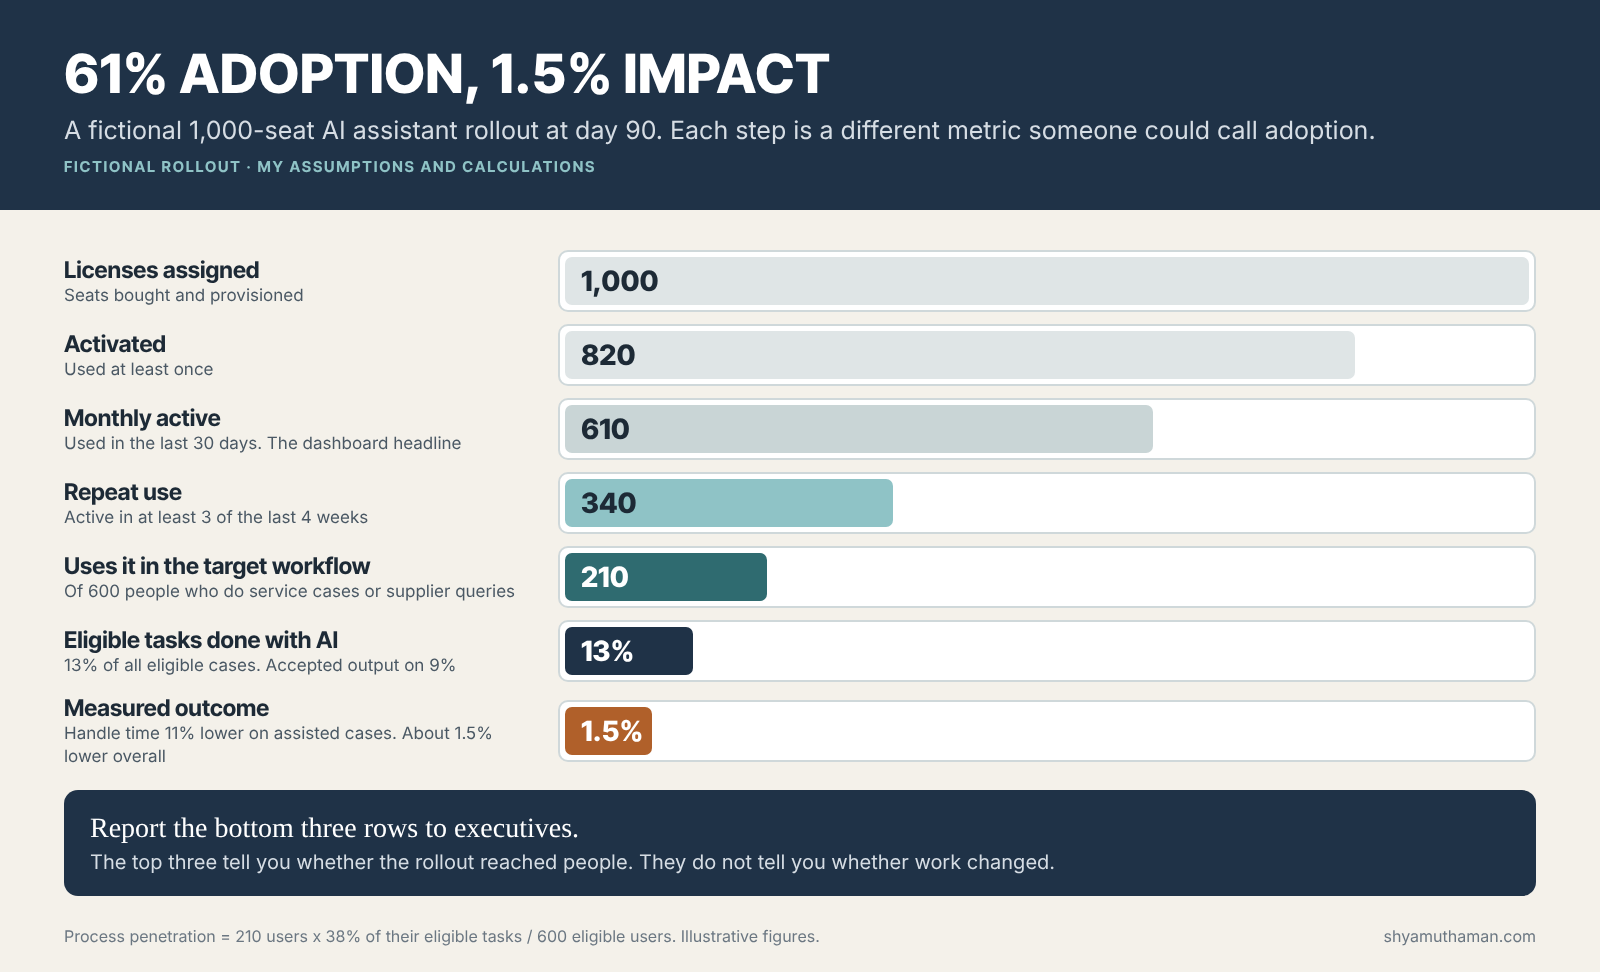
Here is how the fictional rollout breaks down. The company licensed an AI assistant for 1,000 employees in customer service and finance operations. It was bought to speed up two workflows: answering service cases and responding to supplier and invoice queries. Only 600 of the 1,000 people do that work. The other 400 received licenses because the deal was priced per seat.
| Stage at day 90 | Value | Definition used |
|---|---|---|
| Licenses assigned | 1,000 | Seats provisioned |
| Activated | 820 (82%) | Used at least once since launch |
| Monthly active | 610 (61%) | Used at least once in the last 30 days |
| Repeat users | 340 (34%) | Active in at least 3 of the last 4 weeks |
| Target workflow users | 210 (35% of the 600 eligible) | Used AI on a service case or supplier query at least weekly |
| Process penetration | 13.3% of eligible tasks | 210 users × 38% of their eligible tasks ÷ 600 eligible users |
| Accepted output | 71% of AI-assisted tasks, or 9.4% of eligible tasks | Output used with light or no edits |
| Outcome on assisted cases | Handle time 11% lower | Compared with matched cases handled without AI |
| Outcome overall | About 1.5% lower handle time | 13.3% of tasks × 11% |
Three figures change the conversation. First, 140 people who used the tool weekly in month one had stopped by month three. That is abandonment, and it usually has a cause worth finding. Second, 29% of AI-assisted outputs were rejected or heavily rewritten. Third, the reopen rate on assisted service cases was 6.2% against 5.8% for matched cases without AI. That gap is small and may be noise at this volume, but it is the first quality signal to watch.
Which AI adoption metrics should leaders track?
Track five layers. Reach: activation in eligible roles. Habit: repeat use and abandonment. Workflow: share of eligible tasks done with AI. Quality: acceptance, override and error rates against a comparison group. Outcome: the business measure the tool was bought to move, against its baseline. Report the bottom three to executives.
| Layer | Metric | What it answers | Common mistake |
|---|---|---|---|
| Reach | Activation in eligible roles | Did the people who do the target work try it? | Counting all licenses, including people outside the workflow |
| Habit | Repeat use; abandonment | Did trying it turn into a habit? | Reporting monthly actives, which hides one-time use |
| Workflow | Share of eligible tasks done with AI | How much of the work actually changed? | Counting prompts or sessions instead of tasks |
| Quality | Accepted output rate; overrides; error and reopen rates against a comparison group | Is the AI-assisted work as good as before? | Measuring satisfaction surveys instead of output quality |
| Outcome | Cycle time, cost per case, revenue or error cost, against baseline | Did the business result move? | Using self-reported time saved as the outcome |
Self-reported time saved deserves its own warning. Surveys asking “how much time did AI save you this week?” are easy to run and tend to produce large numbers. In my judgment they measure sentiment, which is useful, but they are not evidence of an outcome. Wherever the workflow leaves timestamps in a system, measure from the timestamps.
How do you measure process penetration for AI?
Define the eligible tasks first, such as service cases of certain types or supplier queries, and count them from the system of record. Then count how many of those tasks had AI involvement, using tool logs or a field in the workflow. Penetration is AI-assisted eligible tasks divided by all eligible tasks in the same period.
The funnel above estimates penetration from people: 210 users × 38% of their eligible tasks ÷ 600 eligible users. That shortcut assumes every eligible person carries a similar workload. Once AI use is linked to the task record, count tasks directly.
This is the metric most rollouts cannot produce on day one, because the AI tool’s logs and the workflow system are not connected. The service platform knows the case. The AI tool knows the prompt. Nothing links the two. The cheapest fix I know is a single field in the case or ticket record, set by the user or by an integration, that says AI was used. Without that link you can measure usage and you can measure outcomes, but you cannot connect them.
That missing link is a data problem more than an AI problem. It needs the same definitions, ownership and certified sources that any executive metric needs, which is why I treat it as part of the data readiness work rather than something the AI vendor will solve.
What should leaders review in the first 30, 60 and 90 days?
During the pilot, review accepted output and error types. In the first 30 days, review activation in eligible roles and early drop-off. At 60 to 90 days, review repeat use, penetration, overrides and quality against a comparison group. Once scaled, review the outcome KPI, cost per assisted task and retired process steps.
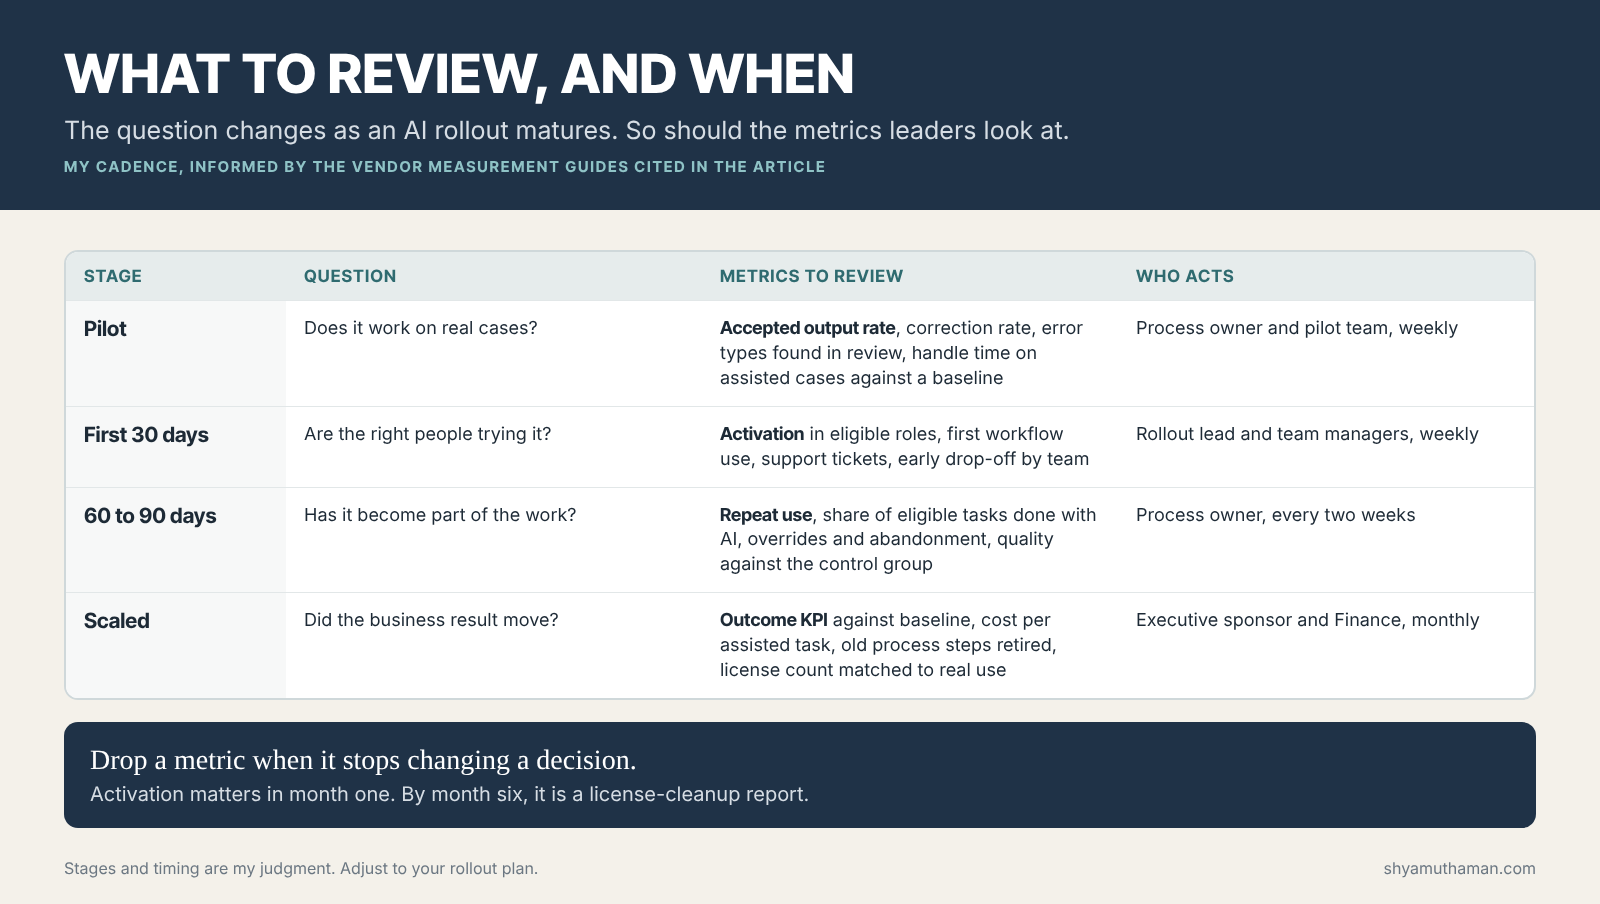
I have deliberately not given target percentages for each stage. I could not find published thresholds I would trust across industries and tools, and inventing them would make this table look more certain than it is. The useful targets are the ones in your business case: the outcome you promised, and the penetration you need to reach it. In this example, if the business case promised a 5% reduction in handle time and assisted cases save 11%, penetration has to reach about 45% of eligible tasks. At 13%, the rollout is a third of the way there.
Two items in the scaled column are often skipped. Retired process steps: if an old checklist, approval or manual lookup still exists alongside the AI path, the organization is paying for both. License count matched to real use: in this example, the 400 seats outside the target workflow are a cost question for the next renewal.
How do you connect AI adoption metrics to ROI?
Multiply penetration by the measured effect per assisted task to get the overall effect, then compare that with the business case. This turns adoption into a forecast of return: if penetration stalls, the return stalls with it, regardless of how many people log in.
That simple multiplication is the bridge between an adoption report and a finance review. It also shows where to put effort. In the fictional rollout, raising penetration among the 210 workflow users from 38% to 60% of their tasks would do more for the outcome than activating the 180 licensed people who never opened the tool. The AI ROI Calculator builds the payback view from these inputs, and my AI ROI roadmap covers baselines and attribution in more depth.
The outcome measure should be one of the executive KPIs leadership already reviews, or a direct driver of one. If it is not, the rollout will be judged on activity. I explain how to choose those measures in executive KPIs. For agents that act on their own rather than assist a person, the cost side changes enough to need its own model, which I cover in AI agent cost, and the monitoring side is covered in AI agent observability.
Where these metrics mislead
- Comparison groups are not controlled experiments. People who adopt AI early may already be faster. Matching cases by type and complexity helps, but it does not remove that bias. A staggered rollout by team gives a cleaner comparison.
- Acceptance is not correctness. A user who accepts a wrong draft counts as accepted. Sample accepted outputs for review, the same way you would sample a new employee’s work.
- Penetration can be gamed. If AI use becomes a target, people will click the button on easy tasks. Watch penetration by task type, not only in total.
- Outcomes have other causes. Case volumes, staffing and policy changes move handle time too. Report the outcome with the other changes that happened in the same period.
Limits of this example
The rollout, the funnel figures, the quality rates and the outcome effect are illustrative assumptions I created on October 4, 2026. The process penetration and overall effect are my calculations from those assumptions. The descriptions of Microsoft and GitHub measurement features come from their public documentation on the same date. The stage cadence and the five-layer structure are my judgment. Nothing here describes a real organization’s rollout.
Official resources
Microsoft Learn: Copilot Analytics introduction
GitHub Docs: GitHub Copilot usage metrics
NIST AI Risk Management Framework, for the measurement and monitoring practices behind the quality layer.
Adoption is where AI meets management. AI to ROI for Business Leaders covers how to set the outcome before rollout and decide whether to scale, and The Data-Driven Executive covers how leadership teams choose and act on the measures that matter.
What AI tool are you rolling out, what data do you have that links its use to the work it was meant to change, and what is blocking a measure of real adoption?