
AI STRATEGY
Most AI portfolios are ranked by the sponsor’s estimate of annual value. I built a fictional portfolio of seven AI proposals for a fictional distributor and ranked them twice. By the sponsor’s numbers, an internal policy assistant and a customer support drafting tool were the top two, together claiming more than $3.2 million a year. After exceptions, review time, realistic adoption, run cost and evidence, the policy assistant fell to fifth and lost $44,000 over three years, and the support tool lost $296,000. An AP exception project that ranked fourth on the sponsor’s list finished first and stayed first under every stress test I ran.
Short answer: an AI prioritization framework should rank projects on value that survives exceptions, human review, adoption, run cost and missing baselines, then test whether the ranking holds when one assumption is wrong. Fund the projects that stay on top. Buy evidence for the ones that move.
This guide is the funding step that sits between two other pieces on my site. AI business use cases covers how to tell whether a single idea is worth pursuing. The AI ROI roadmap covers how to measure the return once a project is running. This article covers the decision in the middle: you have several reasonable ideas and money for two of them. Which two?
What is an AI prioritization framework?
An AI prioritization framework is a repeatable way to choose which AI projects to fund first. It filters out proposals that lack an owner, a baseline or adequate controls, adjusts each claimed benefit for the costs that appear after launch, and checks whether the resulting order survives realistic changes to the assumptions.
Most published frameworks stop at a value-versus-feasibility grid with 1 to 5 scores. Those grids are useful for a first conversation. They have two weaknesses that can sink a funding decision. First, the value score is usually the sponsor’s gross estimate, which ignores the work that does not go away. Second, a weighted score hides how fragile the ranking is. Change one weight and the order changes, and nobody in the room knows whether the winner won on substance or on arithmetic.
The method below fixes both. It still fits on one spreadsheet.
Why does the biggest AI business case often lose?
The biggest claims usually assume every item is handled by AI, every user adopts it and nobody checks the output. In practice exceptions go back to people, review time eats the saving, adoption is partial and run costs recur. Large gross numbers tend to carry the most of these hidden deductions.
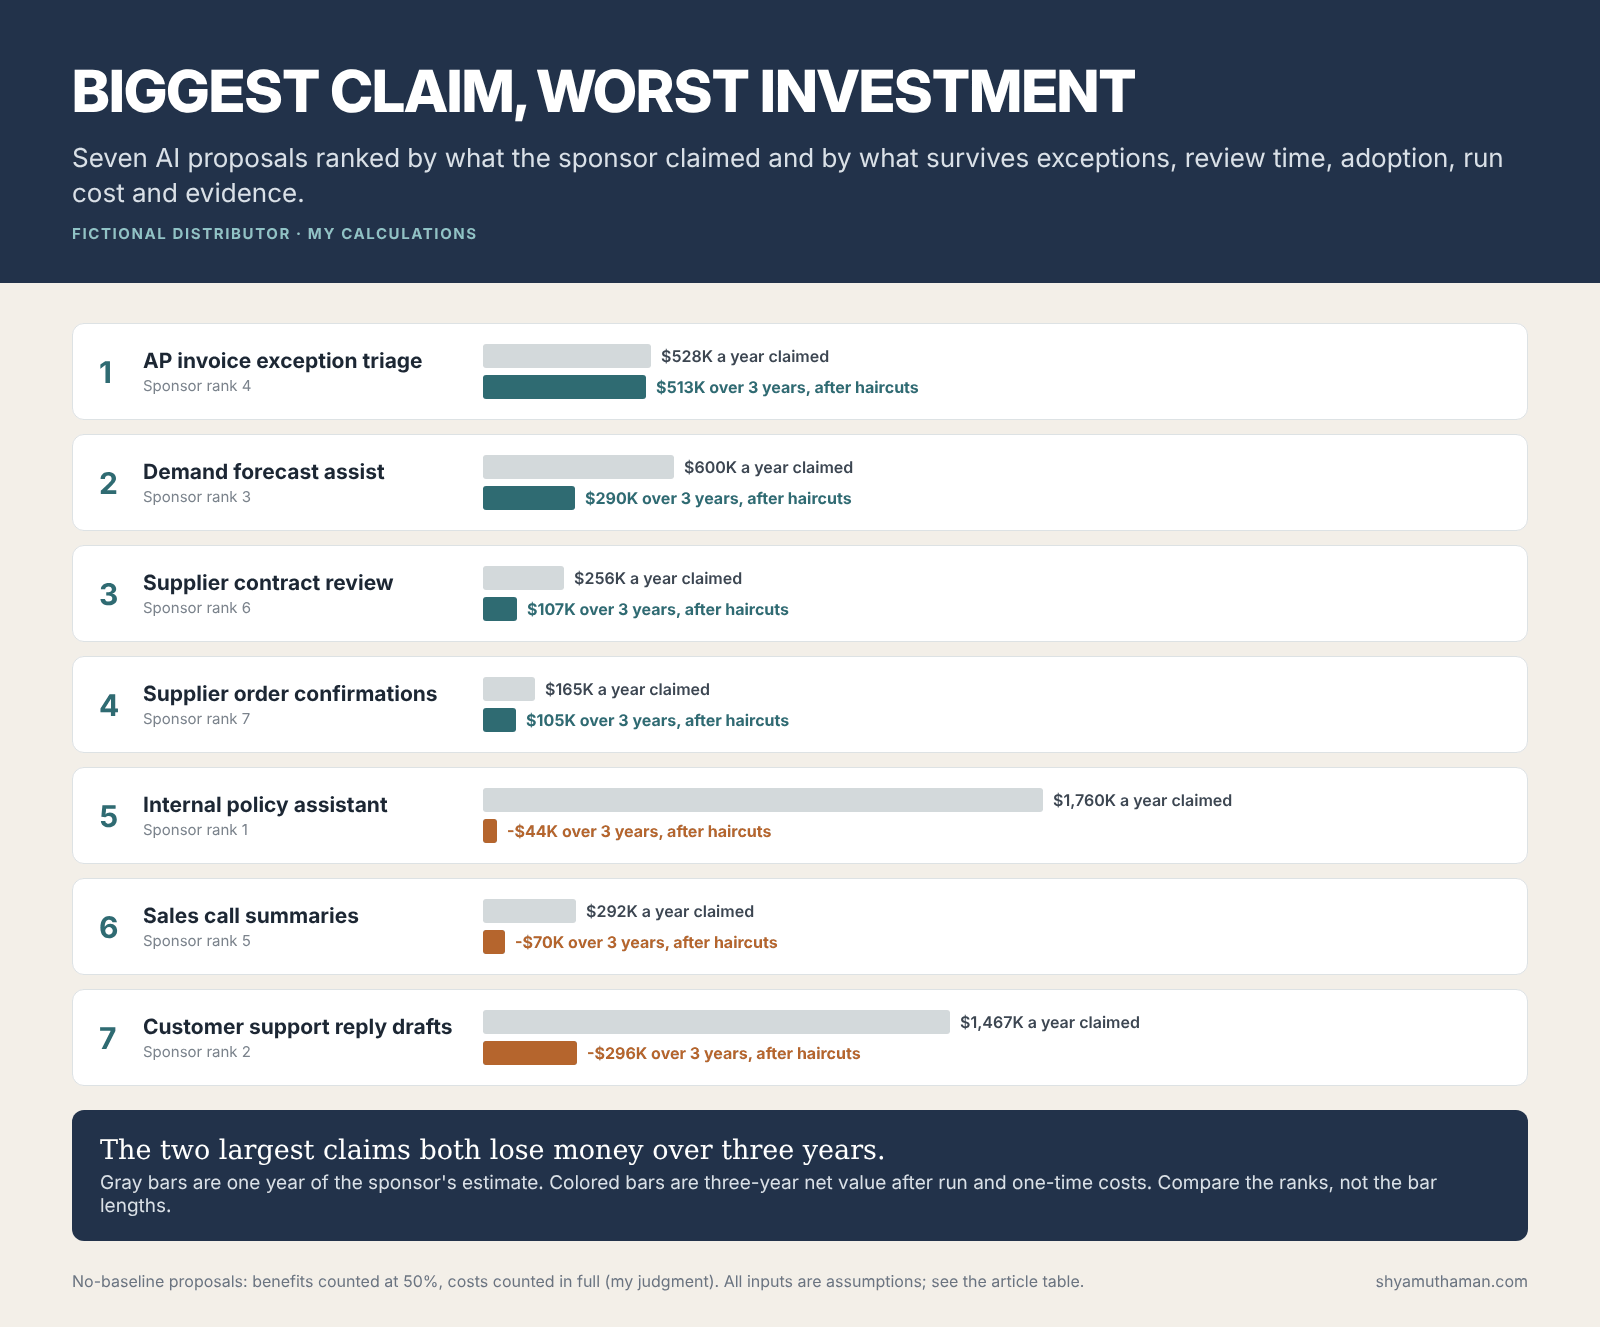
The customer support tool shows the pattern clearly. The sponsor multiplied 400,000 contacts a year by four minutes saved per reply. That gives $1.47 million a year at a $55 loaded hourly rate. My adjusted model assumed 40% of contacts are too complex for a draft to help, 60% of agents use it in the first year, and every draft still takes 2.5 minutes to read and correct before it is sent. The saving per handled contact falls from four minutes to 1.5. Then $180,000 a year in licenses and model costs comes off the top, and $350,000 of build and knowledge-base cleanup comes off once. The project never pays back in three years.
Nothing in that list is exotic. Every adjustment is a question a finance partner or an operations manager would ask in the first review meeting. The framework simply asks them before the money is committed.
The fictional portfolio and its assumptions
For this model, I created seven proposals for a fictional mid-size industrial distributor. Several mirror workflows I have tested with fictional data elsewhere on the site: AP invoice matching, contract review and inventory review. Every number in this table is an assumption I chose to make the method visible. None comes from a real company.
| Proposal | Annual volume | Minutes saved claimed | Exceptions | Review minutes | Year-1 adoption | One-time cost | Run cost per year | Baseline | Failure severity |
|---|---|---|---|---|---|---|---|---|---|
| Customer support reply drafts | 400,000 contacts | 4 | 40% | 2.5 | 60% | $350K | $180K | Yes | 3 |
| Internal policy assistant | 96,000 employee-weeks | 20 | 30% | 5 | 30% | $100K | $120K | No | 2 |
| AP invoice exception triage | 48,000 exceptions | 12 | 25% | 3 | 80% | $110K | $30K | Yes | 3 |
| Demand forecast assist | $600K inventory benefit claimed | n/a | n/a | n/a | 50% | $430K | $60K | Yes | 2 |
| Supplier contract review | 1,800 contracts | 90 | 20% | 45 | 90% | $95K | $25K | Yes | 5 |
| Supplier order confirmations | 30,000 confirmations | 6 | 30% | 1 | 90% | $80K | $25K | Yes | 3 |
| Sales call summaries | 25,000 calls | 10 | 10% | 3 | 40% | $45K | $45K | No | 2 |
Loaded hourly rates are $55 for operations staff, $70 for sales and $95 for the legal reviewers on contracts. Failure severity runs from 1, an error someone notices and fixes in minutes, to 5, an error that creates a legal, financial or safety exposure. The demand forecast proposal is valued on inventory rather than time, so I applied adoption to the $600,000 benefit instead of minutes.
How do you score AI use cases for prioritization?
Score in three passes. First, gate each proposal on outcome owner, baseline and failure severity. Second, convert the sponsor’s claim into net value after exceptions, review minutes, adoption, run cost and one-time cost. Third, rerun the ranking with one assumption changed at a time and see which projects keep their place.
Pass 1: three gates before any scoring
- Outcome owner. A named business leader who will accept or reject the result. A project owned only by IT or the data team stays out of the funding round until someone in the business signs up.
- Baseline. Today’s cycle time, cost per item, error rate or inventory level, measured, not estimated. Without one, the benefit cannot be proven later. I do not reject these proposals. I count their benefit at 50% for ranking purposes while counting their costs in full, which is a judgment call, and route them to a measurement step first.
- Failure severity. A severity 4 or 5 project needs its controls designed and costed before it is compared with anything else. In this portfolio, contract review is severity 5, so I assumed a lawyer reviews every output, which is why its review time is 45 of the 90 minutes saved.
Pass 2: the net value formula
For each proposal I calculated:
Annual gross benefit = volume × (1 − exception rate) × adoption × (minutes saved − review minutes) ÷ 60 × hourly rate + other benefit × adoption
Annual net value = annual gross benefit − annual run cost
Three-year value = 3 × (annual gross benefit × evidence weight − annual run cost) − one-time cost, where the evidence weight is 100% with a baseline and 50% without one.
The evidence weight discounts only the benefit. Run cost and one-time cost are spending commitments, so they count in full whether or not the benefit is proven.
Here is the AP example worked through. 48,000 exceptions × 75% that AI can handle × 80% adoption gives 28,800 items. Each saves 12 minus 3 review minutes, so 9 minutes. That is 4,320 hours, or $237,600 at $55 an hour. Subtract $30,000 a year in run cost to get $207,600. Over three years, minus $110,000 of one-time cost, the result is $512,800, and payback lands at about six months.
I deliberately left out discounting, ramp curves and tax. They matter for a final business case. For choosing between seven ideas, they rarely change the order, and every extra input is one more thing a sponsor can tune.
What happens to the rankings when assumptions change?
In this portfolio, the top project stayed first in all six scenarios, while places two to five changed in every one of the five stress tests. That pattern is the useful signal: a stable leader can be funded now, and proposals whose rank moves with one assumption need evidence before they need money.
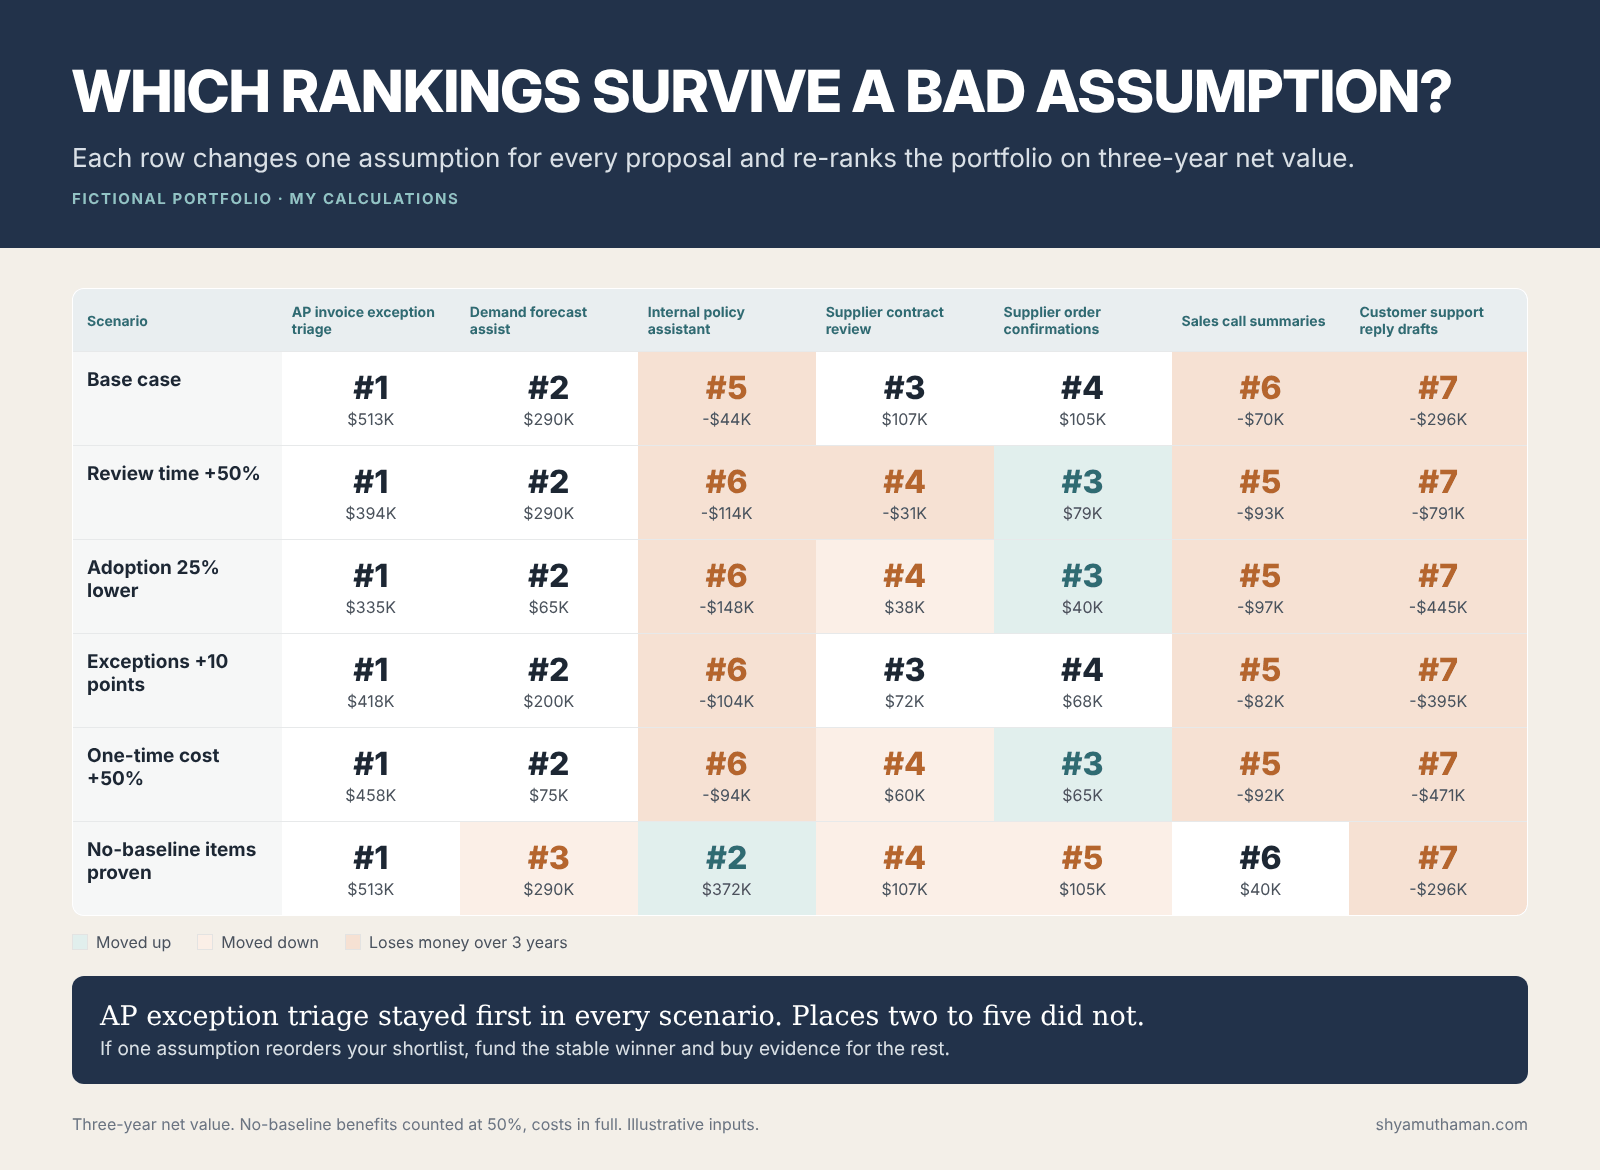
Four results stood out when I ran the scenarios.
- Review time is the most dangerous assumption. A 50% increase in review minutes turned contract review from $107,000 positive to $31,000 negative over three years. When review is close to the saving, small errors in the estimate flip the sign.
- Adoption hit the forecasting project hardest. Its value depends on planners acting on the forecast. At 25% lower adoption, its three-year value fell from $290,000 to $65,000, a drop of almost 80%.
- Data cost decides the forecasting case. $250,000 of its $430,000 one-time cost is data consolidation. If that work costs twice the estimate, the project is worth $40,000 over three years.
- A baseline moved the policy assistant from fifth to second. If its time savings were measured instead of assumed, it would be worth $372,000 instead of losing $44,000. That makes measuring the baseline worth more than building a better assistant.
The support drafting tool lost money in every scenario. I calculated what would have to be true for it to break even over three years: review time would need to fall from 2.5 minutes to 1.7 minutes per draft. To beat the AP project, review would need to fall to 0.4 minutes, which is a different product with a different risk profile. That finding is more useful to the sponsor than a rejection. It tells them exactly what a pilot has to prove.
How should leaders decide which AI project to fund first?
Sort proposals into lanes instead of funding straight down a ranked list. Fund now what is positive in every scenario with a baseline and recoverable failures. Fix data first where data work drives cost. Prove first where baselines or review time decide the result. Decline what loses money under every test.
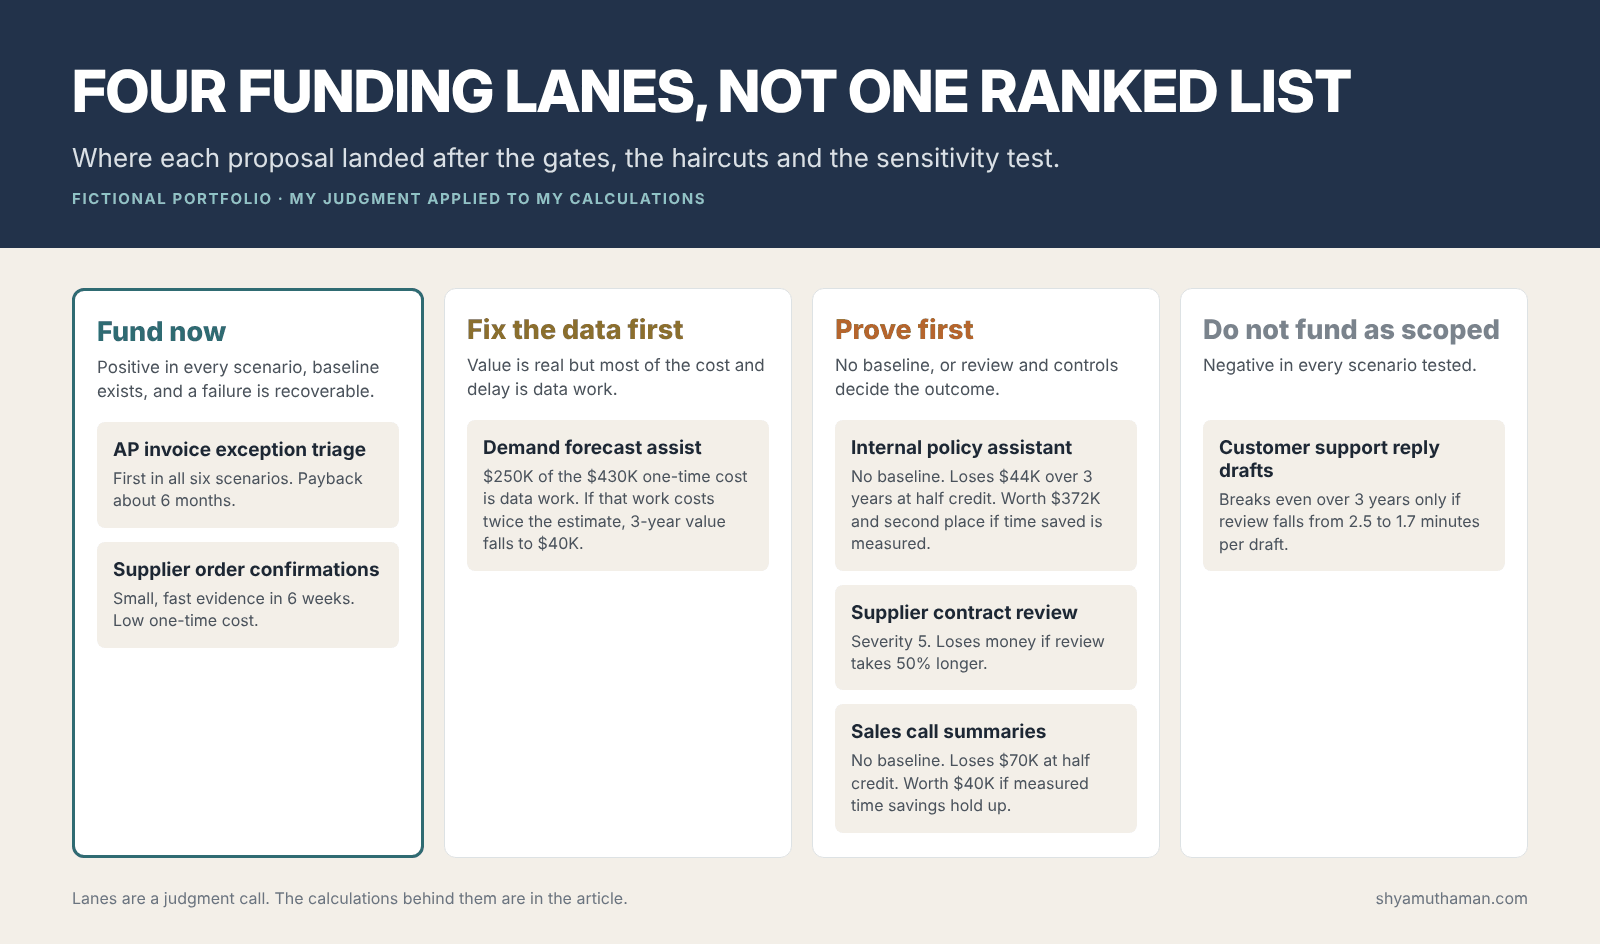
Lanes change the conversation with sponsors. “Not now” becomes “here is the evidence that would move you up.” In this portfolio the policy assistant sponsor gets a four-week time study, not a build budget. The forecasting sponsor gets a data consolidation project with its own milestone. The support sponsor gets a narrower pilot aimed at the 1.7-minute review threshold.
I would also put the two “fund now” projects in front of the same steering group at the same time. AP triage carries the value. Supplier confirmations are small, but they produce evidence in six weeks and use the same review and exception patterns, so the organization learns faster for little extra money.
What data does an AI prioritization framework need?
Each proposal needs annual volume, minutes per item today, the share of items that are exceptions, expected review minutes, a realistic adoption rate, one-time and run costs, a measured baseline and a failure severity rating. Most organizations already hold volume and cost data. Exception rates and review times usually have to be sampled.
This is where data leadership and AI leadership meet. Volume, cycle time and error rates come from operational systems, and they are only useful if the definitions are agreed. If finance and operations disagree on what counts as an invoice exception, the AP number in the table above is a guess. A short data readiness check before the prioritization meeting saves arguments during it, and the free AI readiness assessment shows whether the team behind each proposal can deliver it.
For review minutes, I would not accept an estimate from the vendor or the sponsor. Pull 30 real items, have someone check an AI draft of each, and time it. In my own AI agent evaluation tests, the answers that took longest to check were the ones that looked plausible and were wrong, which is exactly the case a demo never shows.
Where does this framework break?
It undervalues strategic bets whose payoff is new revenue or capability rather than saved effort, and it treats every hour saved as worth the full loaded rate. It also inherits whatever bias sits in the exception and adoption estimates. Use it to order operational AI projects, and judge strategic ones separately.
- Saved hours are not saved cash. I valued time at the loaded rate. Finance will only count it as cash if headcount growth slows or the time is redeployed to work with a measurable result. Report hours separately from dollars until that happens.
- Strategic options do not fit the formula. A pricing model that could open a new segment has value this method cannot see. I would score those against a separate strategic budget rather than force them into the same list.
- The 50% evidence weight is arbitrary. It is a deliberate penalty for missing baselines, chosen to be large enough to change behavior. A different organization could choose 30% or 70%. Pick one, write it down and apply it to everyone.
- Illustrative inputs prove the method, not the conclusion. Nothing here says AP projects beat support projects in general. With your volumes, review times and costs, the order could reverse.
Copy this AI prioritization scorecard
This is the column set I use. Fill the first nine before the funding meeting. The last three are calculated. The free spreadsheet version below does the calculations and the stress test for you.
| Column | What goes in it | Who provides it |
|---|---|---|
| Outcome owner | Named business leader accountable for the result | Sponsor |
| Baseline | Measured current value and how it was measured | Data team |
| Annual volume | Items, cases or decisions per year | Operations system of record |
| Minutes per item today | Measured handling time | Time study or system timestamps |
| Exception rate | Share of items AI will not handle | Sample of recent items |
| Review minutes | Time to check one AI output | Timed sample of 30 or more |
| Year-one adoption | Share of eligible work done with AI | Rollout plan, challenged by the process owner |
| One-time and run cost | Build, data work, licenses, model use, support | Delivery team and Finance |
| Failure severity | 1 to 5, plus the controls a 4 or 5 needs | Risk or compliance |
| Annual net value | Formula above | Calculated |
| Three-year value | Evidence-weighted, after one-time cost | Calculated |
| Rank stability | Number of scenarios in which the rank holds | Calculated |
Get the AI Prioritization Scorecard
An Excel workbook with the net value formulas, the stress test and the seven example proposals already filled in. Enter your email and I’ll send you the download link.
Check your inbox
- Open the email from Shyam Uthaman.
- Click Download the spreadsheet.
- Open the workbook in Excel or Google Sheets and start on the How to use tab.
Complete the check
Nothing after a few minutes? Check your spam or promotions folder, or message me on LinkedIn.
Once a project is chosen, the next documents are the pilot plan and the monitoring plan. My guide to running an AI pilot with guardrails covers stop criteria, and the AI ROI Calculator builds the payback view Finance will ask for. If the chosen project is an agent, the cost structure is different enough to need its own model, which I cover in AI agent cost per successful task.
Limits of this analysis
All seven proposals, their volumes, rates, costs and severities are illustrative assumptions I created on October 4, 2026 to demonstrate the method. The calculations are mine, done in a short Python script and checked by hand for the AP example shown above. The 50% evidence weight and the funding lanes are my judgment.
Correction, October 6, 2026: the first version applied the 50% evidence weight to net value, which also halved run costs for the two proposals without a baseline. The weight now applies only to their benefits. The policy assistant moved from third to fifth and now loses $44,000 over three years, sales call summaries moved from a $2,000 loss to a $70,000 loss, and the charts were updated. AP exception triage still ranks first in every scenario. Nothing here describes a real company, client or employer project, and the results should not be read as benchmarks for any of these use cases.
Official resources
NIST AI Risk Management Framework, useful for structuring the failure severity gate.
MIT CISR: What is data monetization?, on why operational improvements only count once they are turned into financial value.
Choosing the first AI project is a business decision before it is a technology decision. AI to ROI for Business Leaders covers use case selection, business cases and pilot gates in depth. The baseline and decision-rights problems underneath it are the subject of The Data-Driven Executive.
Which AI proposals are competing for your next budget, what data do you have on their volumes and review times, and which assumption do you trust least?