
BEGINNER DATABRICKS TUTORIAL
Databricks Genie gives business users a familiar chat interface for asking questions about company data. Instead of starting with SQL, they can ask a question such as “What were gross sales last quarter?” and receive a written answer, result table, chart, and the SQL used to calculate it.
If you have used ChatGPT or Claude, the interaction will feel familiar. You type a question, receive an answer, and ask follow-up questions without starting over. However, Genie has a much narrower purpose. It is designed to answer questions using the tables, metadata, business instructions, and trusted assets connected to a specific Genie Agent.
In this tutorial, I create a Genie Agent from four connected sales tables. I explain the data before configuring the agent, provide the exact instructions and prompts I used, and inspect the SQL behind the answer.
Download the tutorial data
The download contains four fictional CSV files: customers, orders, order items, and products. You can load them into your Databricks workspace and follow the same example.
Download the Databricks Genie Data Files
All customers, products, and transactions in these files are fictional.
How this tutorial fits with my other Databricks articles
I wrote this introductory article to familiarize new readers with Databricks Genie. My intent is not to recreate every basic Databricks lesson before moving into more detailed experiments.
Databricks already offers excellent learning paths for platform fundamentals, Databricks SQL, AI/BI, dashboards, and certification preparation. I have included links to those resources later in this article. They are the better choice if you want structured training covering the platform from the beginning.
My articles serve a different purpose. I want to test business and technical use cases under realistic conditions. That means using connected datasets, supplying business rules, asking repeatable questions, inspecting generated SQL, and checking the answers independently.
I am less interested in showing a perfect product demonstration where everything works on the first attempt. I want to find out where these tools perform well, where they misunderstand the question, and where a confident answer can still hide incorrect logic.
What is Databricks Genie?
Databricks Genie is a conversational analytics interface inside the Databricks Data and AI Platform. A user can ask a question such as “What were gross sales last quarter?” and receive a written response, result table, chart, and the SQL used to calculate the answer.
The user does not need to write the SQL. However, someone still needs to prepare the data and explain the company’s definitions. Genie must know which tables it can use, how those tables relate, and what terms such as sales, active customer, or target attainment mean inside that company.
The Databricks official documentation: AI/BI overview explains how Genie Agents, AI/BI dashboards, and Unity Catalog semantics work together.
A short history of Databricks Genie
Databricks introduced AI/BI in June 2024 as a business intelligence offering built around two related experiences. AI/BI Dashboards addressed recurring questions through dashboards, while Genie added a conversational interface for broader questions that users might ask while examining the data.
Genie initially appeared in public preview and was described through Genie Spaces. Databricks continued adding features such as trusted assets, response review, benchmark questions, generated visualizations, and connections between dashboards and Genie.
Genie became generally available in December 2024. Earlier versions of the product used the name Genie Space. The current interface uses Genie Agent, which better reflects the wider set of configuration, testing, and monitoring features now associated with it.
You may still encounter older articles, videos, screenshots, or API references that use the term Genie Space. They are discussing an earlier version of the same conversational analytics product.
The Databricks official documentation: AI/BI 2024 release history provides a dated record of these product changes.
How Genie compares with ChatGPT or Claude
ChatGPT and Claude are general-purpose assistants. They can explain concepts, write content, review supplied files, generate code, and help with many unrelated tasks. Their broad capability is part of their value.
Genie is closer to a data analyst assigned to a specific subject area. The analyst has access to approved tables and has been given instructions about how the company defines its metrics.
A sales Genie Agent might know about orders, customers, products, returns, and sales targets. It should not attempt to answer unrelated questions outside that data domain.
| Characteristic | ChatGPT or Claude | Databricks Genie |
|---|---|---|
| Primary purpose | General assistance across many kinds of tasks | Conversational analysis of selected business data |
| Data context | Conversation context, uploaded files, connected tools, and available knowledge | Selected Unity Catalog data sources and agent configuration |
| Business definitions | Must be supplied through the conversation or connected information | Can be maintained as agent instructions, examples, and trusted assets |
| Calculation evidence | Depends on the task and tools available | Can expose the generated SQL and result table |
| Typical user | Anyone seeking general assistance | Business users and analysts asking questions about governed company data |
My view is that Genie should not be treated as ChatGPT pointed at a database. Its value comes from connecting a conversational interface to governed data while preserving a query that can be inspected.
The SQL is especially important. It gives analysts and data teams a way to examine how Genie interpreted the business question. However, visible SQL does not automatically make the answer correct. Someone still needs to check the joins, filters, dates, aggregation level, and business definitions.
Why business context still matters
Consider the question, “What were sales last quarter?” It sounds simple, but the database does not contain a universal definition of sales.
Should cancelled orders be excluded? Should discounts reduce sales? Should returns be deducted? Does the quarter use the order date, shipment date, invoice date, or payment date?
A person familiar with the company may understand those rules without discussing them every time. Genie needs those definitions to be written somewhere it can use them.
For this beginner example, I will provide a small set of direct instructions. My separate Databricks Genie business-context experiment examines this problem in more depth by comparing results before and after detailed business instructions are added.
Meet the source data
The fictional company sells software products to small, mid-market, and enterprise customers across four sales regions. The complete dataset contains six tables, but this beginner tutorial uses only four of them.
Returns and sales targets are excluded from this introductory agent. This keeps the relationship path easy to follow while still providing enough information to calculate sales by product category, customer segment, and region.
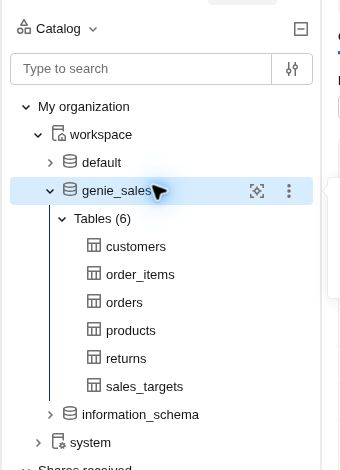
| Table | Grain | Purpose |
|---|---|---|
customers |
One row per customer | Provides the customer segment and sales region. |
orders |
One row per order | Provides the order date, customer, and order status. |
order_items |
One row per product line | Provides quantity, unit price, and discount percentage. |
products |
One row per product | Provides the product name and category. |
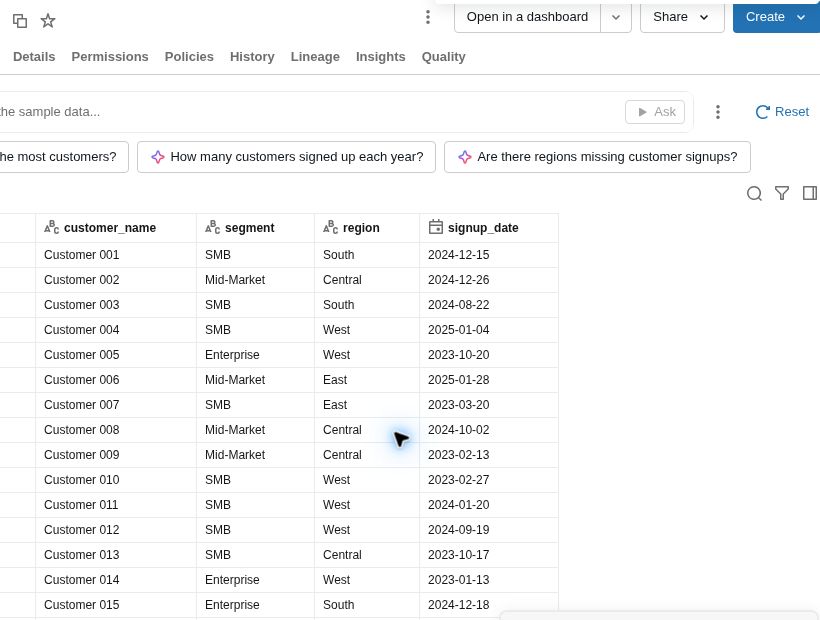
The customers table
The customer master contains the customer name, market segment, sales region, and signup date. Each customer can place several orders. The table connects to the orders table through customer_id.
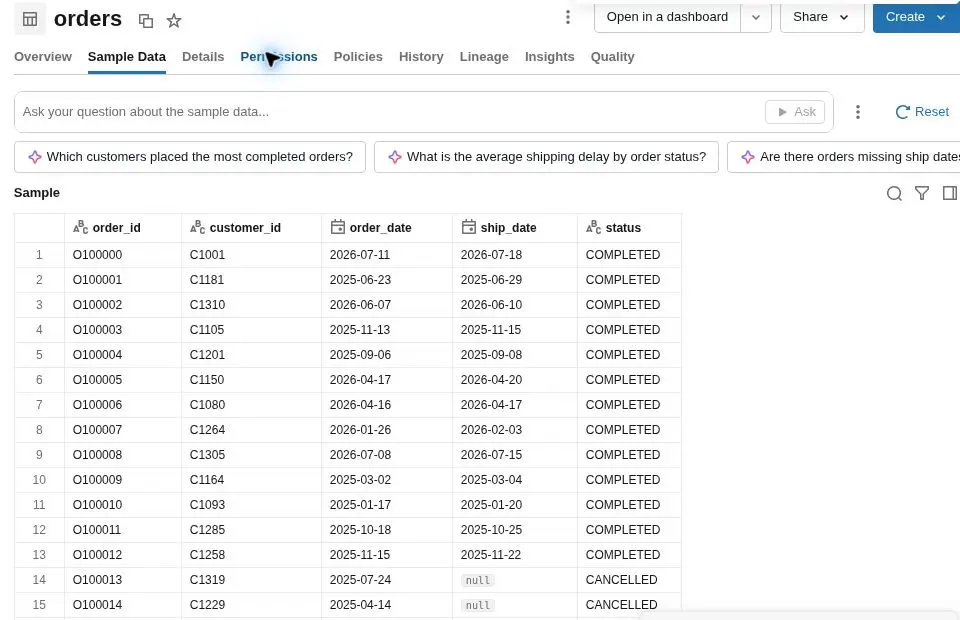
The orders table
Each order belongs to one customer. The order header records the order date, ship date, and status. An order can be completed, cancelled, or pending.
For this tutorial, only completed orders count toward sales. The order date controls the reporting period unless the user specifically asks for another date.
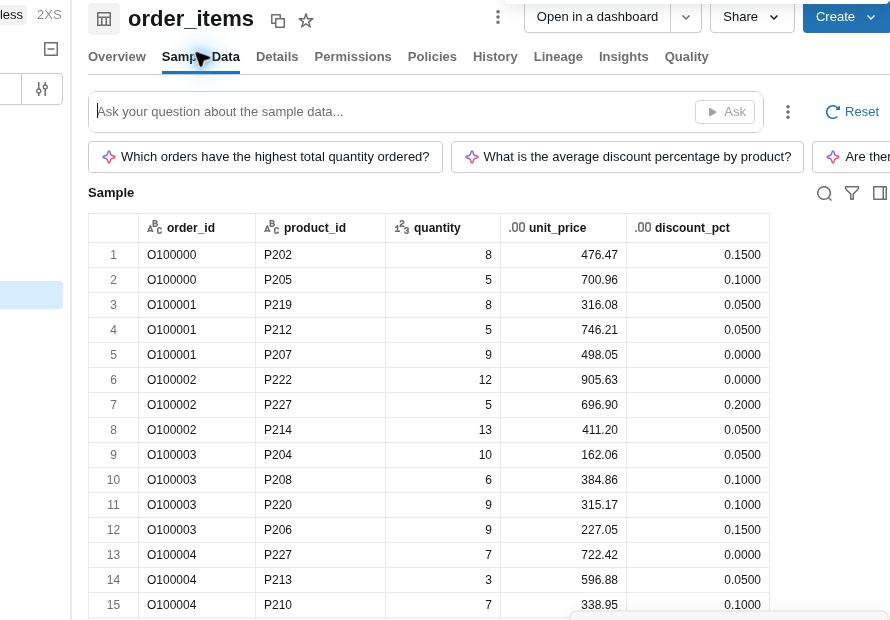
The order_items table
An order can contain several products. Therefore, the values needed to calculate sales sit at the order-line level rather than in the order header.
Each line records a product, quantity, unit price, and discount percentage. Gross sales are calculated with this formula:
quantity × unit_price × (1 - discount_pct)
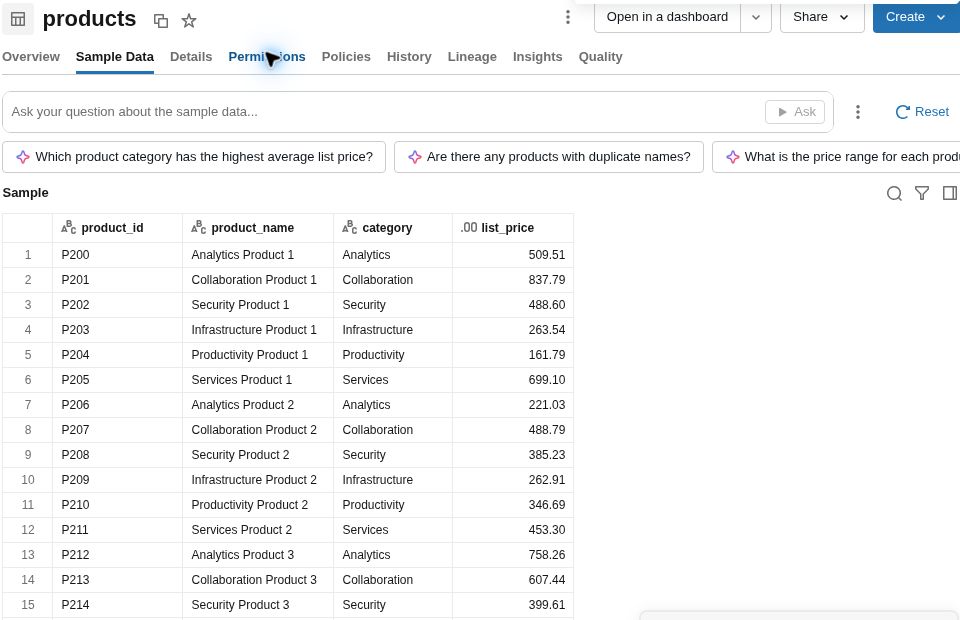
The products table
The product master converts each product ID into a recognizable product name and category. The category field allows Genie to group sales into Analytics, Collaboration, Infrastructure, Productivity, Security, and Services.
How the tables connect
The four tables form a direct relationship path. Customers connect to orders, orders connect to order items, and order items connect to products.
customers.customer_id = orders.customer_id

orders.order_id = order_items.order_id

order_items.product_id = products.product_id
Our first question needs the orders, order_items, and products tables. The customers table remains available for later questions about segments or regions.
Open Genie Agents
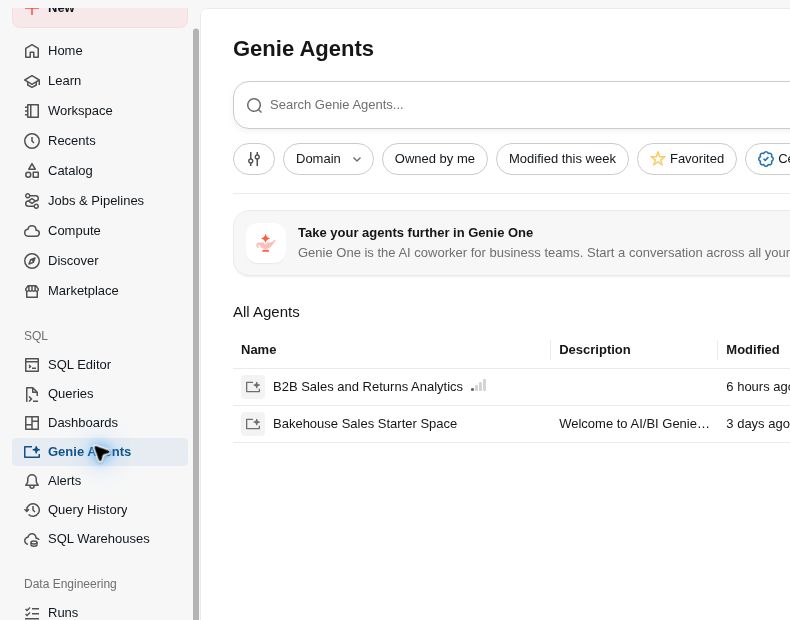
Open your Databricks workspace. In the left sidebar, expand SQL and select Genie Agents. Then click New.
Account information has been removed from these screenshots. Your top navigation bar may show more information than mine.
Select the four tables
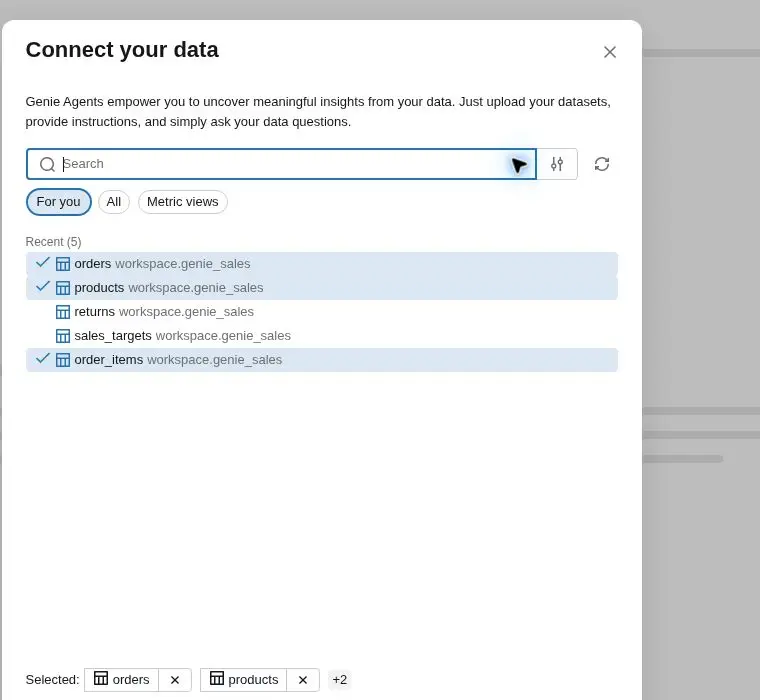
Search the catalog and select the following tables from workspace.genie_sales:
customersordersorder_itemsproducts
Click Create after all four tables have been selected. Databricks will create the agent and may suggest a name, description, or sample questions.
Confirm the configured sources
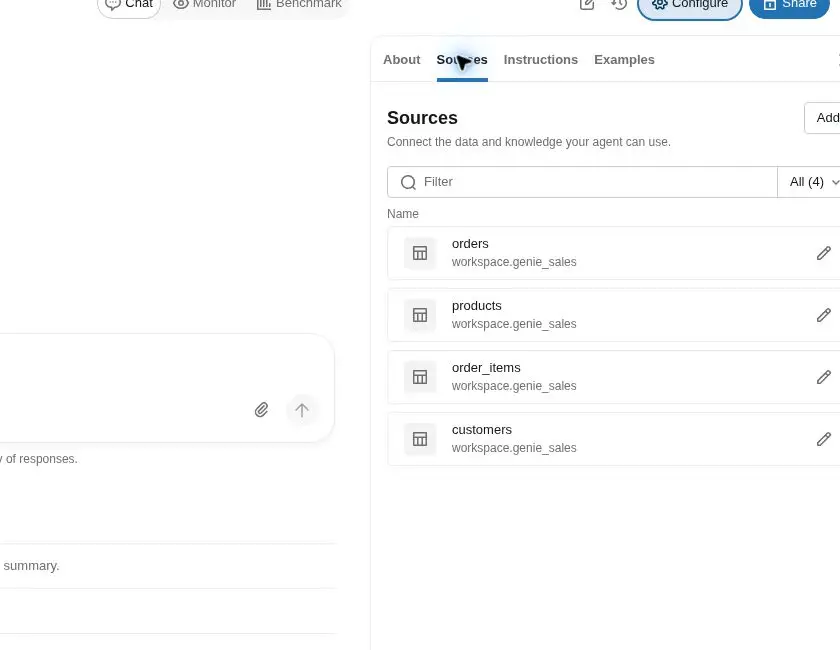
Open Configure and select Sources. Confirm that the list contains the four intended tables.
This check matters because a missing or unrelated table changes what the agent can do. For example, omitting products would prevent Genie from grouping sales by product category.
Add the business instructions
Select the Instructions tab. Paste the following text into the General Instructions field:
This is a fictional B2B sales dataset.

Use only orders where orders.status = 'COMPLETED' when calculating sales.

Calculate gross sales as SUM(order_items.quantity * order_items.unit_price * (1 - order_items.discount_pct)).

Use orders.order_date for sales reporting unless the user asks for another date.

Join customers to orders using customer_id, orders to order_items using order_id, and order_items to products using product_id.
Save the instructions before asking the first question.
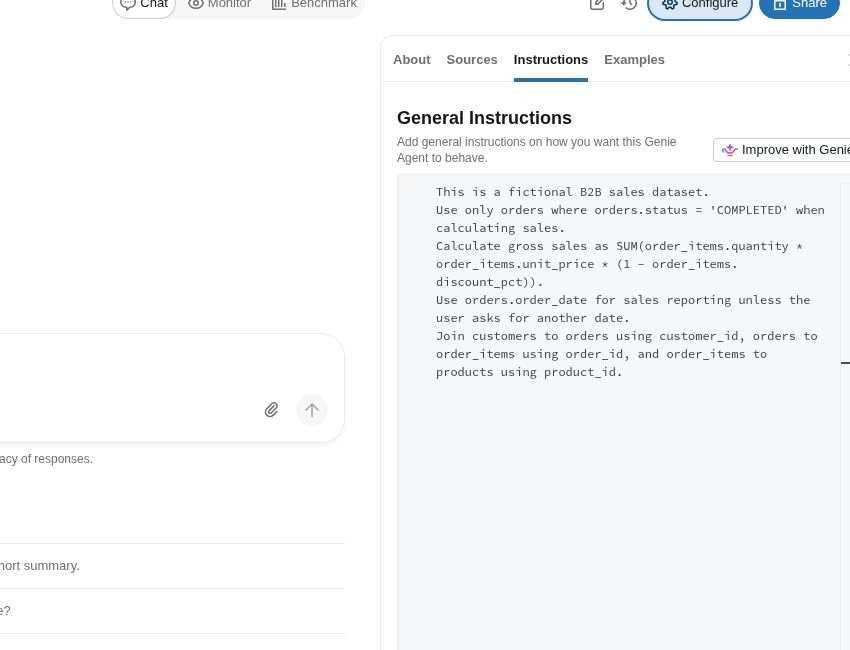
My view: This configuration step is more important than the chat screen. A well-written prompt cannot consistently compensate for missing business definitions. If the agent does not know what sales means, it can generate valid SQL for the wrong interpretation.
Ask the first question
Return to Chat and keep Chat mode selected. Enter this prompt exactly:
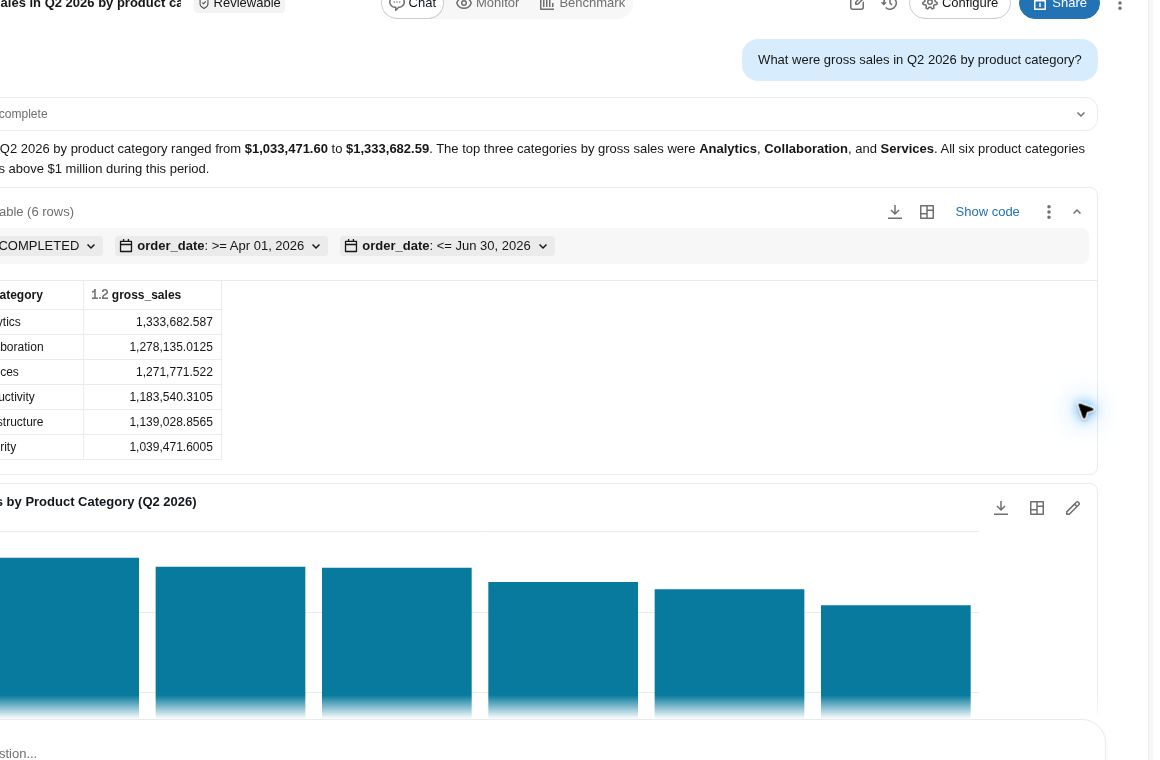
What were gross sales in Q2 2026 by product category?
Genie returned six product categories and created a chart. Analytics ranked first with gross sales of $1,333,682.587. Collaboration and Services followed.
Inspect the generated SQL
Click Show code under the result. Do not rely on the written response or chart alone. Review the query that produced the answer.
In this run, Genie used the expected tables and joins. It applied the completed-order filter, used the Q2 2026 order-date range, and calculated gross sales from the order-line fields.
SELECT
  p.category,
  SUM(
    oi.quantity
    * oi.unit_price
    * (1 - oi.discount_pct)
  ) AS gross_sales
FROM workspace.genie_sales.orders o
JOIN workspace.genie_sales.order_items oi
  ON o.order_id = oi.order_id
JOIN workspace.genie_sales.products p
  ON oi.product_id = p.product_id
WHERE o.status = 'COMPLETED'
  AND o.order_date >= '2026-04-01'
  AND o.order_date <= '2026-06-30'
  AND p.category IS NOT NULL
GROUP BY p.category;
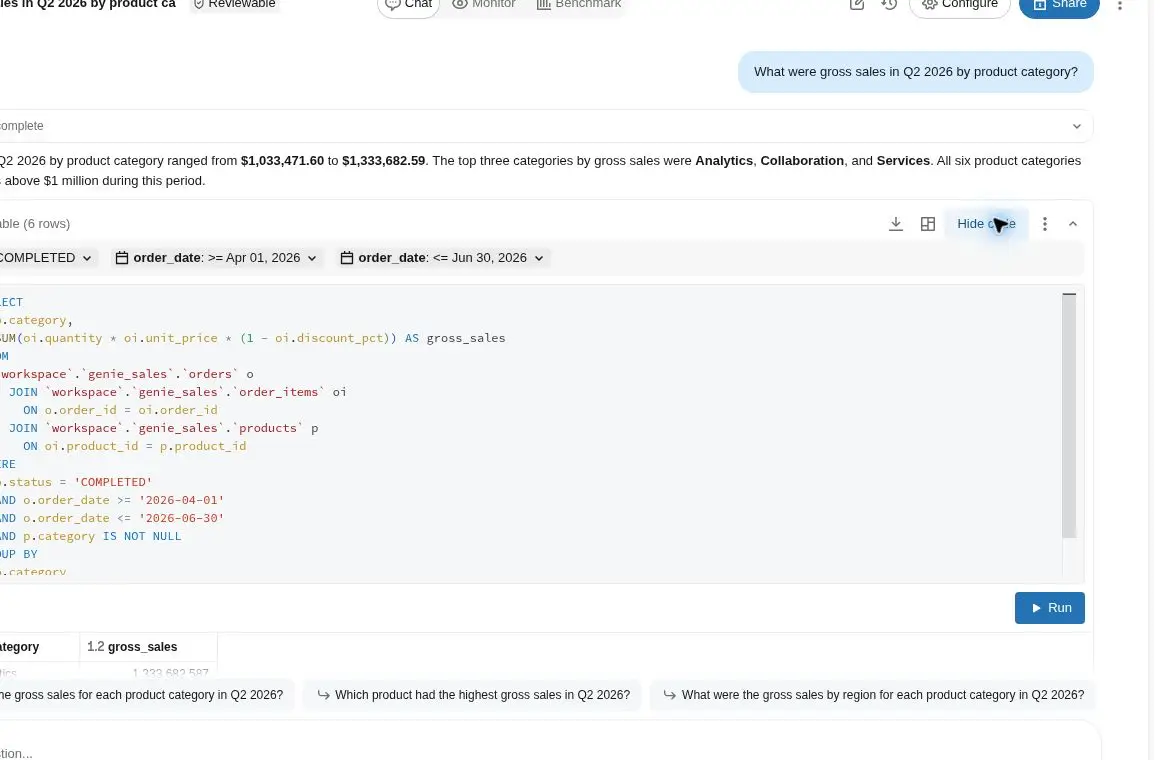
This is where I think Genie becomes more useful than a basic chat interface placed over a database. The generated SQL gives a technical reviewer something concrete to inspect. It creates a bridge between the business question and the calculation performed by the system.
Test conversational context
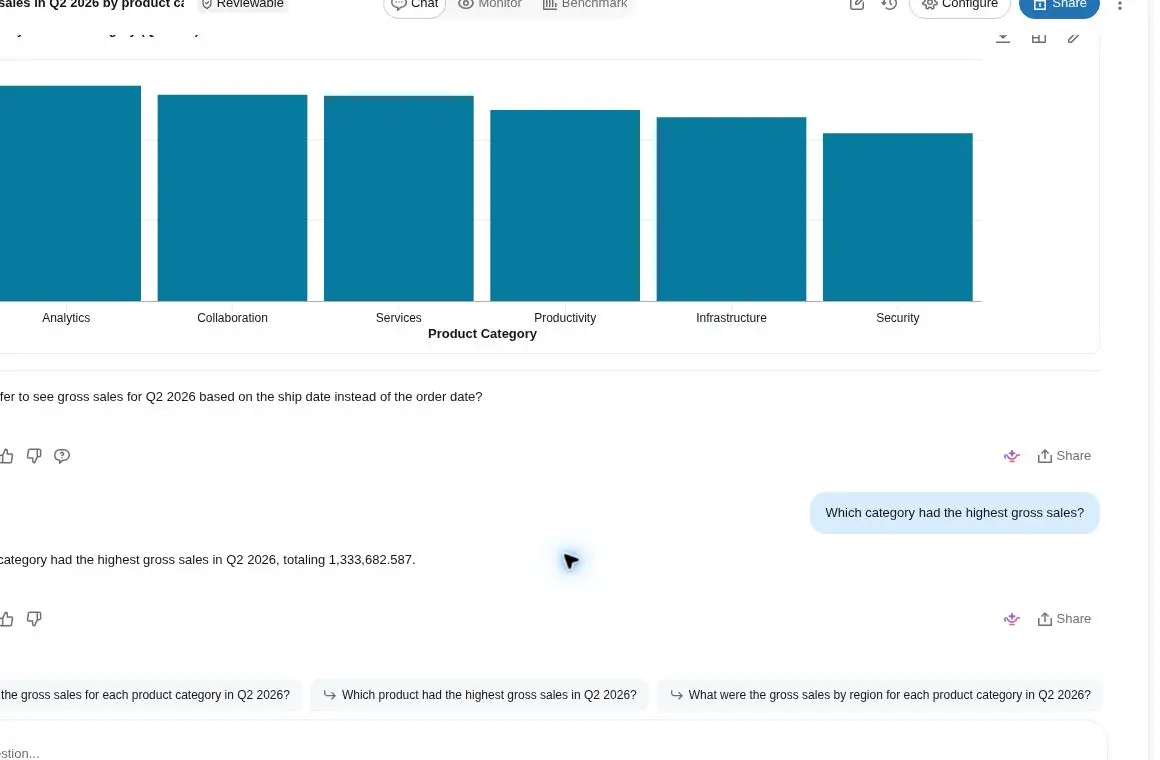
Ask a shorter follow-up without repeating the reporting period:
Which category had the highest gross sales?
Genie retained the Q2 2026 context from the previous question and answered Analytics. The response matched the highest value in the original result table.
More prompts to test
The same four-table agent can answer several related questions. Try these prompts one at a time and inspect the SQL generated for each response.
-
How many completed orders did each customer segment place in Q2 2026? -
Show gross sales by region for Q2 2026. -
Which five products had the highest gross sales in Q2 2026? -
Compare monthly gross sales for April, May and June 2026.
These questions gradually introduce the customer table, ranking logic, and monthly aggregation. They are useful tests because each one changes a specific part of the SQL while retaining the same definition of gross sales.
What to check before trusting an answer
Begin by confirming that the selected sources contain every field needed by the question. Then inspect the generated SQL for the expected joins, filters, date range, grouping, and formula.
Pay close attention to the grain of each table. Joining two tables at different levels can duplicate records and inflate a metric even when the query runs without an error.
Compare at least one important result with a SQL query that you already trust. A polished chart can still be based on an incorrect business definition or a faulty join.
I would also test several variations of the same question. Ask for another quarter, change the grouping, and use a follow-up question. A dependable agent should retain the business definition while adjusting the relevant filters or dimensions.
Continue learning with Databricks
This tutorial covers one focused Genie example. Databricks provides official courses, documentation, and working demos for readers who want broader platform training.
| Learning resource | What it covers | Who should use it |
|---|---|---|
| Databricks official documentation: Training and certification | Introductory courses, role-based training, skill badges, and paid courses covering data engineering, analytics, machine learning, and AI. | Start here if you are new to the Databricks platform. |
| Databricks official documentation: AI/BI overview | AI/BI concepts, Genie Agents, dashboards, Unity Catalog semantics, and related administration topics. | Use this after completing the example in this article. |
| Databricks official documentation: Set up a Genie Agent | Current product requirements, source configuration, instructions, sample questions, and sharing options. | Keep this open while building your own agent. |
| Databricks official documentation: AI/BI Sales Pipeline demo | A self-paced example combining sales data, AI/BI dashboards, and Genie. | Use this to move from a small agent to a larger working example. |
| Databricks official documentation: Data Analyst Associate certification | Databricks SQL, data discovery, queries, visualizations, dashboards, data modeling, governance, and Genie. | Use this if you want a structured study target and formal certification. |
Suggested learning order: Complete the introductory Databricks training, review the AI/BI documentation, build a small agent, and then run the official sales pipeline example. Consider the Data Analyst Associate certification once you have enough practical experience.
Continue with my Databricks experiments
The official Databricks learning paths are excellent for learning the platform basics. Follow those resources if you want structured instruction covering Databricks SQL, Unity Catalog, AI/BI, dashboards, data engineering, and certification topics.
Follow my experiments for business use cases and real-world technical tests. I use realistic datasets, repeatable prompts, business instructions, generated SQL, and independent checks to see what performs well and what does not work reliably in practice.
My Databricks Genie business-context experiment extends this example to six tables and seventeen business questions.
That experiment compares a baseline agent with a configured agent. It shows how business instructions changed measured accuracy and examines a case where the generated SQL still produced the wrong answer.
What are you trying to build with Genie?
I would like these articles to reflect the problems people are attempting to solve rather than only the examples I choose myself. If you are working with Databricks Genie, leave a comment describing the business use case, the types of tables involved, and the questions you want the agent to answer.
Also share where you are getting stuck. It could be table selection, business instructions, unreliable SQL, unclear metrics, testing, or user adoption. I may use recurring problems as the basis for future experiments and publish the data, prompts, results, and failures so others can reproduce them.
Tested in Databricks Free Edition in September 2026. Workspace features, labels, and usage quotas can change. Refer to the Databricks official documentation: Free Edition for current details.