
PRACTICAL AI EXPERIMENT
A semantic layer AI setup improved Databricks Genie’s performance on the same 14 business questions from 79% with prompt-based rules to 93% with governed metrics. My manual review found all 14 final answers business-correct. More importantly, the semantic layer fixed a return-rate calculation that had previously produced 56.89% instead of the verified 4.11%.
Short answer: governed metrics helped because Genie no longer had to rebuild important business calculations from prose every time. The final setup scored 13 of 14, or 93%, in Databricks Chat benchmark mode. The remaining rejection was a percentage representation mismatch rather than a wrong business result.
This was the third stage of an experiment I started with six fictional sales tables. The raw-table baseline scored 0%. Adding plain-language business rules raised Databricks’ official score to 79%, but Genie still generated incorrect SQL for return rate. I wanted to answer a different question this time: what changes when reusable business logic moves out of an AI prompt and into a governed semantic layer?
If you have not seen the earlier test, start with my Databricks Genie business-context experiment. If you are completely new to Genie, the Databricks Genie beginner tutorial covers the basic setup first.
Does a semantic layer improve AI analytics accuracy?
In this controlled experiment, yes. Databricks’ official score increased from 79% with business rules stored mainly in prompt instructions to 93% when reusable metric logic moved into governed Metric Views. Manual review also found all 14 final answers business-correct, although Databricks officially accepted 13.
| Round | What Genie received | Databricks score | My business review |
|---|---|---|---|
| A | Six raw tables with neutral metadata | 0 of 14, 0% | Not separately adjusted |
| B | Same tables plus plain-language business definitions | 11 of 14, 79% | 13 of 14, 93% |
| C | Governed Metric Views plus a smaller instruction set | 13 of 14, 93% | 14 of 14, 100% |
The larger change was not the score alone. Round B’s remaining real failure was dangerous because Genie explained the correct return-rate formula but generated SQL at the wrong grain and returned 56.89%. Round C queried a governed return-rate measure and returned the correct business value.
The semantic layer also handled grouped return rates correctly and made “sales” resolve consistently to net revenue. It did not solve every conversational ambiguity, and it could describe where a metric changed without establishing a real-world cause.
What is a semantic layer for AI?
A semantic layer for AI is a governed set of business measures, dimensions and metadata that gives an AI system reusable business meaning before it generates a query. The AI can ask for a defined metric such as net revenue or return rate instead of reconstructing the calculation from raw tables for every question.
In Databricks, Unity Catalog Metric Views provide this type of reusable business-metric layer. A Metric View can define measures, dimensions, display names and synonyms that Genie can use when answering natural-language questions.
Databricks documents Metric Views in its Unity Catalog Metric Views documentation. Semantic metadata such as display names and synonyms is covered in the agent metadata documentation.
How is a semantic layer different from prompt instructions?
Prompt instructions describe how an AI should interpret a business rule, while a semantic layer stores reusable metric logic closer to the data. With the semantic approach, the model can query a governed measure directly instead of translating a prose definition into fresh SQL every time.
| Approach | Example | What the AI must do |
|---|---|---|
| Prompt instruction | “Return rate means return amount divided by gross revenue.” | Interpret the definition and recreate the SQL correctly |
| Governed semantic measure | MEASURE(return_rate) |
Filter and group an already defined business metric |
Round B showed why this distinction matters. Genie understood the written return-rate rule but still created the wrong aggregation pattern. The semantic layer reduced the amount of metric logic the model had to invent.
What did this semantic layer AI experiment test?
The experiment kept the data, questions, business definitions and expected answers fixed while changing where reusable business logic lived. Round B stored most of that logic in prose instructions. Round C moved reusable calculations into governed semantic objects and left only conversational rules in the prompt.
Kept fixed: the six source tables, frozen fictional records, 14 deterministic questions, business definitions and independently verified ground-truth SQL.
Changed: reusable metric calculations moved from prompt text into governed semantic objects.
I used Databricks Chat benchmark mode for the main A/B/C comparison. Databricks compares the generated Chat result with the result from the supplied ground-truth SQL. Agent mode uses a different evaluation approach, so I kept its results outside the main comparison. Databricks explains the benchmark process in its Genie testing documentation.
The experiment was run in Databricks Free Edition. The final Round C benchmark was run on October 2, 2026.
Can I reproduce this semantic layer AI experiment?
Yes. The downloadable package contains the SQL and YAML used to create the semantic objects, validation queries, the final Genie instructions, the benchmark question list and the independent ground-truth SQL. It uses the same six-table fictional dataset from my earlier Genie experiment.
Download the Semantic Layer AI Experiment
The package builds on the same fictional six-table dataset from my earlier Genie business-context experiment. Download that source-data package first if you are reproducing the entire experiment from zero.
What data did the experiment use?
The experiment reused a six-table fictional B2B sales model with deliberately different grains for customers, orders, order lines, products, returns and monthly regional targets. Those grain differences are important because they reproduce the type of join and aggregation mistakes that can make an AI-generated business answer look reasonable while still being wrong.
| Table | Grain | Purpose |
|---|---|---|
customers |
One row per customer | Customer name, segment and region |
orders |
One row per order | Order date, ship date, status and customer |
order_items |
One row per product line | Quantity, price and discount |
products |
One row per product | Product and category |
returns |
One row per returned product transaction | Return date and return amount |
sales_targets |
One row per month and region | Regional revenue target |
Revenue starts at order-line grain. Returns are separate events recognized by return date. Targets already exist at month-region grain. Joining those three facts directly before controlling the grain can multiply values.
This is also why I treat semantic modeling as part of data readiness for AI. An AI interface does not remove the need to define grain, timing and business meaning correctly.
How do you build a semantic layer for Databricks Genie?
I used three governed Metric Views instead of forcing every definition into one large model. One handled sales and returns, one handled region-month target analysis, and one handled completed-order customer activity. Separating them by business grain made the calculations easier to validate and reduced accidental duplication.
| Metric View | Purpose | Measures |
|---|---|---|
sales_semantic_metrics |
Sales, return, customer and product analysis | Gross revenue, net revenue, return amount, return rate, ship-date revenue |
regional_performance_metrics |
Region-month target analysis | Target revenue, target attainment, target shortfall |
customer_activity_metrics |
Completed-order customer activity | Active customers |
Step 1: normalize sales and returns before calculating metrics
First, I converted sales and returns into compatible reporting events. Completed order lines contribute positive revenue. Returns contribute a separate return amount recognized on return date.
This avoids the Round B error where detail-level revenue and return rows were combined at incompatible grains.
Show the sales and return event SQL
CREATE OR REPLACE VIEW workspace.genie_sales.sales_semantic_events AS

SELECT
  'ORDER_DATE' AS date_basis,
  o.order_date AS reporting_date,
  o.order_id,
  o.customer_id,
  c.customer_name,
  c.segment AS customer_segment,
  c.region AS sales_region,
  oi.product_id,
  p.product_name,
  p.category AS product_category,
  CAST(
    oi.quantity * oi.unit_price * (1 - oi.discount_pct)
    AS DECIMAL(38,12)
  ) AS gross_revenue_component,
  CAST(0 AS DECIMAL(38,12)) AS return_amount_component
FROM workspace.genie_sales.orders o
JOIN workspace.genie_sales.order_items oi
  ON o.order_id = oi.order_id
JOIN workspace.genie_sales.customers c
  ON o.customer_id = c.customer_id
JOIN workspace.genie_sales.products p
  ON oi.product_id = p.product_id
WHERE o.status = 'COMPLETED'

UNION ALL

SELECT
  'SHIP_DATE' AS date_basis,
  o.ship_date AS reporting_date,
  o.order_id,
  o.customer_id,
  c.customer_name,
  c.segment AS customer_segment,
  c.region AS sales_region,
  oi.product_id,
  p.product_name,
  p.category AS product_category,
  CAST(
    oi.quantity * oi.unit_price * (1 - oi.discount_pct)
    AS DECIMAL(38,12)
  ) AS gross_revenue_component,
  CAST(0 AS DECIMAL(38,12)) AS return_amount_component
FROM workspace.genie_sales.orders o
JOIN workspace.genie_sales.order_items oi
  ON o.order_id = oi.order_id
JOIN workspace.genie_sales.customers c
  ON o.customer_id = c.customer_id
JOIN workspace.genie_sales.products p
  ON oi.product_id = p.product_id
WHERE o.status = 'COMPLETED'
  AND o.ship_date IS NOT NULL

UNION ALL

SELECT
  'ORDER_DATE' AS date_basis,
  r.return_date AS reporting_date,
  r.order_id,
  o.customer_id,
  c.customer_name,
  c.segment AS customer_segment,
  c.region AS sales_region,
  r.product_id,
  p.product_name,
  p.category AS product_category,
  CAST(0 AS DECIMAL(38,12)) AS gross_revenue_component,
  CAST(r.return_amount AS DECIMAL(38,12)) AS return_amount_component
FROM workspace.genie_sales.returns r
JOIN workspace.genie_sales.orders o
  ON r.order_id = o.order_id
JOIN workspace.genie_sales.customers c
  ON o.customer_id = c.customer_id
JOIN workspace.genie_sales.products p
  ON r.product_id = p.product_id

UNION ALL

SELECT
  'SHIP_DATE' AS date_basis,
  r.return_date AS reporting_date,
  r.order_id,
  o.customer_id,
  c.customer_name,
  c.segment AS customer_segment,
  c.region AS sales_region,
  r.product_id,
  p.product_name,
  p.category AS product_category,
  CAST(0 AS DECIMAL(38,12)) AS gross_revenue_component,
  CAST(r.return_amount AS DECIMAL(38,12)) AS return_amount_component
FROM workspace.genie_sales.returns r
JOIN workspace.genie_sales.orders o
  ON r.order_id = o.order_id
JOIN workspace.genie_sales.customers c
  ON o.customer_id = c.customer_id
JOIN workspace.genie_sales.products p
  ON r.product_id = p.product_id;
Step 2: define the governed sales measures
Next, I created sales_semantic_metrics. This stores the calculations that I did not want Genie rebuilding from prose: gross revenue, returns, net revenue, return rate and the ship-date variants.
I also added semantic synonyms. For example, “sales”, “revenue” and “net sales” point to the governed net-revenue measure.

Show the core governed measures
measures:

  - name: gross_revenue
    expr: >
      SUM(
        CASE
          WHEN date_basis = 'ORDER_DATE'
          THEN gross_revenue_component
          ELSE 0
        END
      )
    display_name: Gross Revenue
    synonyms:
      - gross sales
      - sales before returns

  - name: net_revenue
    expr: >
      SUM(
        CASE
          WHEN date_basis = 'ORDER_DATE'
          THEN gross_revenue_component - return_amount_component
          ELSE 0
        END
      )
    display_name: Net Revenue
    synonyms:
      - sales
      - revenue
      - net sales
      - total sales

  - name: return_rate
    expr: >
      SUM(
        CASE
          WHEN date_basis = 'ORDER_DATE'
          THEN return_amount_component
          ELSE 0
        END
      )
      /
      NULLIF(
        SUM(
          CASE
            WHEN date_basis = 'ORDER_DATE'
            THEN gross_revenue_component
            ELSE 0
          END
        ),
        0
      )
    display_name: Return Rate
    synonyms:
      - returns rate
      - return percentage

Step 3: keep sales targets at region-month grain
Sales targets needed their own semantic object because the source table already has one row per region and month. I aggregated sales to that same grain first, then joined the target.
WITH monthly_sales AS (
  SELECT
    DATE_TRUNC('MONTH', reporting_date) AS month,
    sales_region AS region,
    SUM(gross_revenue_component) AS gross_revenue,
    SUM(return_amount_component) AS return_amount,
    SUM(gross_revenue_component)
      - SUM(return_amount_component) AS net_revenue
  FROM workspace.genie_sales.sales_semantic_events
  WHERE date_basis = 'ORDER_DATE'
  GROUP BY
    DATE_TRUNC('MONTH', reporting_date),
    sales_region
)

SELECT
  t.month,
  t.region,
  COALESCE(s.gross_revenue, 0) AS gross_revenue,
  COALESCE(s.return_amount, 0) AS return_amount,
  COALESCE(s.net_revenue, 0) AS net_revenue,
  t.target_revenue
FROM workspace.genie_sales.sales_targets t
LEFT JOIN monthly_sales s
  ON t.month = s.month
 AND t.region = s.region;
The resulting regional_performance_metrics Metric View defines target revenue, target attainment and target shortfall. The complete YAML is in the download package.
Step 4: model active customers from completed orders
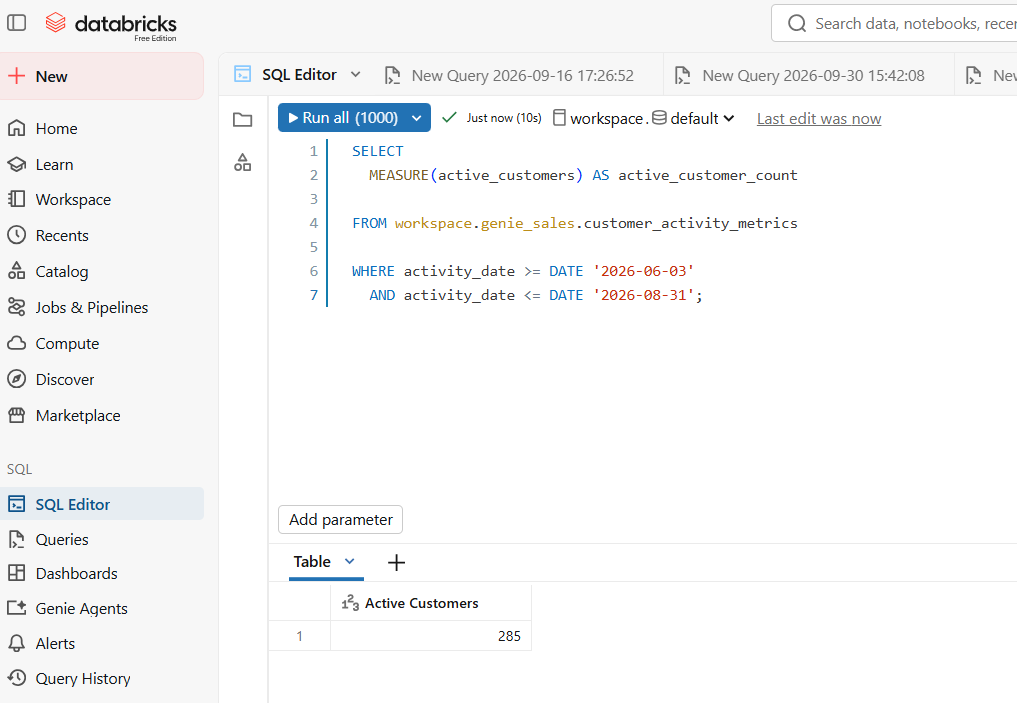
Active customers required a separate business grain too. Counting customers from the combined sales-and-return event model included customers who appeared only because of return activity during the 90-day window.
The business definition required at least one completed order, so I created a completed-order customer-activity source.
CREATE OR REPLACE VIEW workspace.genie_sales.customer_activity_events AS

SELECT
  o.order_date AS activity_date,
  o.order_id,
  o.customer_id,
  c.customer_name,
  c.segment AS customer_segment,
  c.region AS sales_region
FROM workspace.genie_sales.orders o
JOIN workspace.genie_sales.customers c
  ON o.customer_id = c.customer_id
WHERE o.status = 'COMPLETED';
The corresponding Metric View defines active_customers as COUNT(DISTINCT customer_id) across the selected activity-date period.
Why should you validate a semantic layer before giving it to AI?
A semantic layer can still contain wrong business logic, so its measures should be validated independently before an AI agent uses them. I found both a precision problem and an activity-grain problem during this experiment. Neither was caused by Genie’s generated SQL. They were defects in my semantic design.
My first event view rounded every order-line revenue amount to two decimal places before aggregation. That produced Q2 gross revenue of $7,245,630.97. The original ground-truth calculation preserves additional precision until after aggregation and produced $7,245,629.89.
That small choice also changed Central’s Q2 target shortfall from $241,279.55 to the expected $241,279.86.
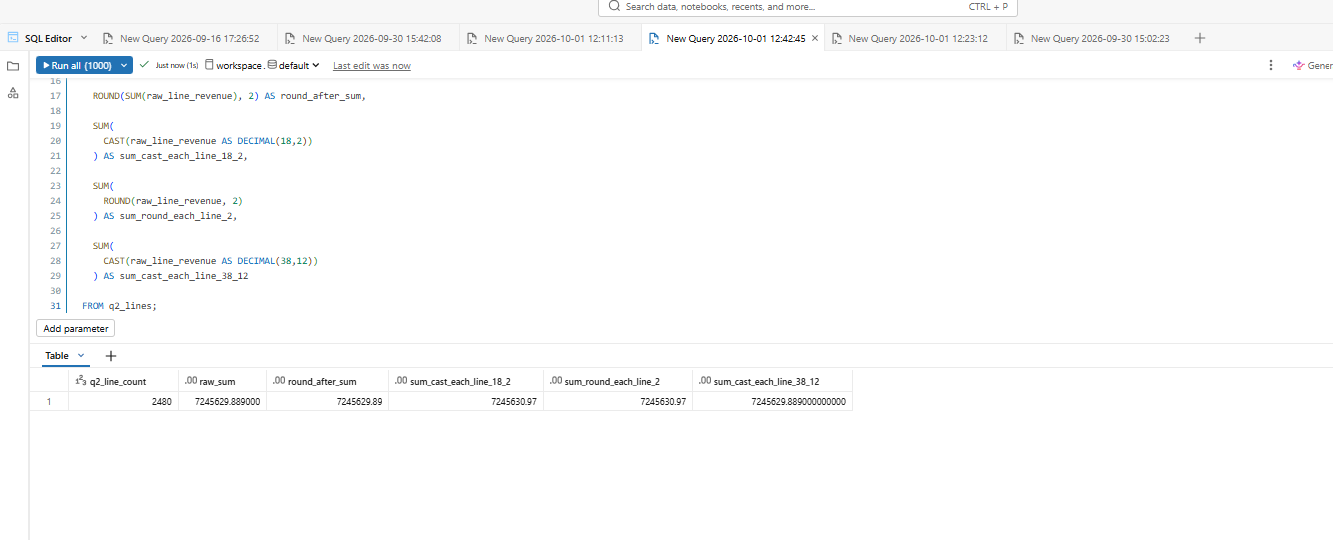
What this taught me: metric governance does not make a definition correct automatically. Grain, time logic and precision still need independent tests.
How did I configure Genie for the final semantic layer test?
The final Genie Agent received only three governed Metric Views, no raw source tables and no curated example SQL. This kept Round C focused on whether the semantic objects could carry reusable business meaning without giving Genie the benchmark answers or exposing implementation tables directly.
workspace.genie_sales.sales_semantic_metrics
workspace.genie_sales.regional_performance_metrics
workspace.genie_sales.customer_activity_metrics
I kept curated examples at zero. None of the benchmark SQL was given to Genie as an example.
The remaining instruction block contained only context that was still conversational rather than metric math:
Business context

This is a fictional B2B company. Reporting data is complete through 2026-08-31.

Use calendar quarters. All monetary amounts are USD.

Use governed measures from the attached metric views whenever an appropriate governed measure exists. Do not recreate a governed metric from lower-level fields when the metric view already defines it.

Customer conventions

An active customer as of a specified date is a customer with at least one completed order in the 90 calendar days ending on and including that date.

When a user asks for highest-value customers, rank customers by trailing-12-month net revenue ending on the specified as-of date.

For an as-of date, top-N customer revenue share means the trailing-12-month net revenue of the top N customers divided by total trailing-12-month net revenue for all customers over the same period.

Trailing 12 months as of August 31, 2026 means September 1, 2025 through August 31, 2026 inclusive.

Ambiguity

If the user asks for "best customers" without specifying what best means, ask for the metric.

If the user asks how much sales grew without specifying comparison periods, ask for the periods.

If the user asks which region "performed best" without specifying a performance measure, ask which measure they mean.

Do not silently choose a business definition when the question is genuinely ambiguous.
What happened when the semantic layer was configured incorrectly?
An intermediate semantic-layer run scored only 8 of 14, or 57%, because the correct target Metric View was not attached and the customer-activity definition still used the wrong event grain. The low score was caused by configuration and modeling gaps rather than evidence that the semantic approach itself had failed.
I had attached sales_semantic_events instead of regional_performance_metrics, so Genie could not see the governed target measures.
The customer activity logic also had not yet been separated from return events, so Genie returned 289 active customers instead of the verified 285.
I kept that run separate from the final result. I corrected the source list, created the completed-order activity metric, validated the semantic objects independently and created a fresh agent.
This is an important operational point. A well-designed semantic object does not help an AI agent if the wrong object is connected.
What was the final Databricks Genie benchmark result?
The final governed setup scored 13 of 14, or 93%, in Databricks Chat benchmark mode. That compares with 11 of 14, or 79%, when the same business logic lived mainly in prose instructions. The serious return-rate SQL error from Round B also disappeared.
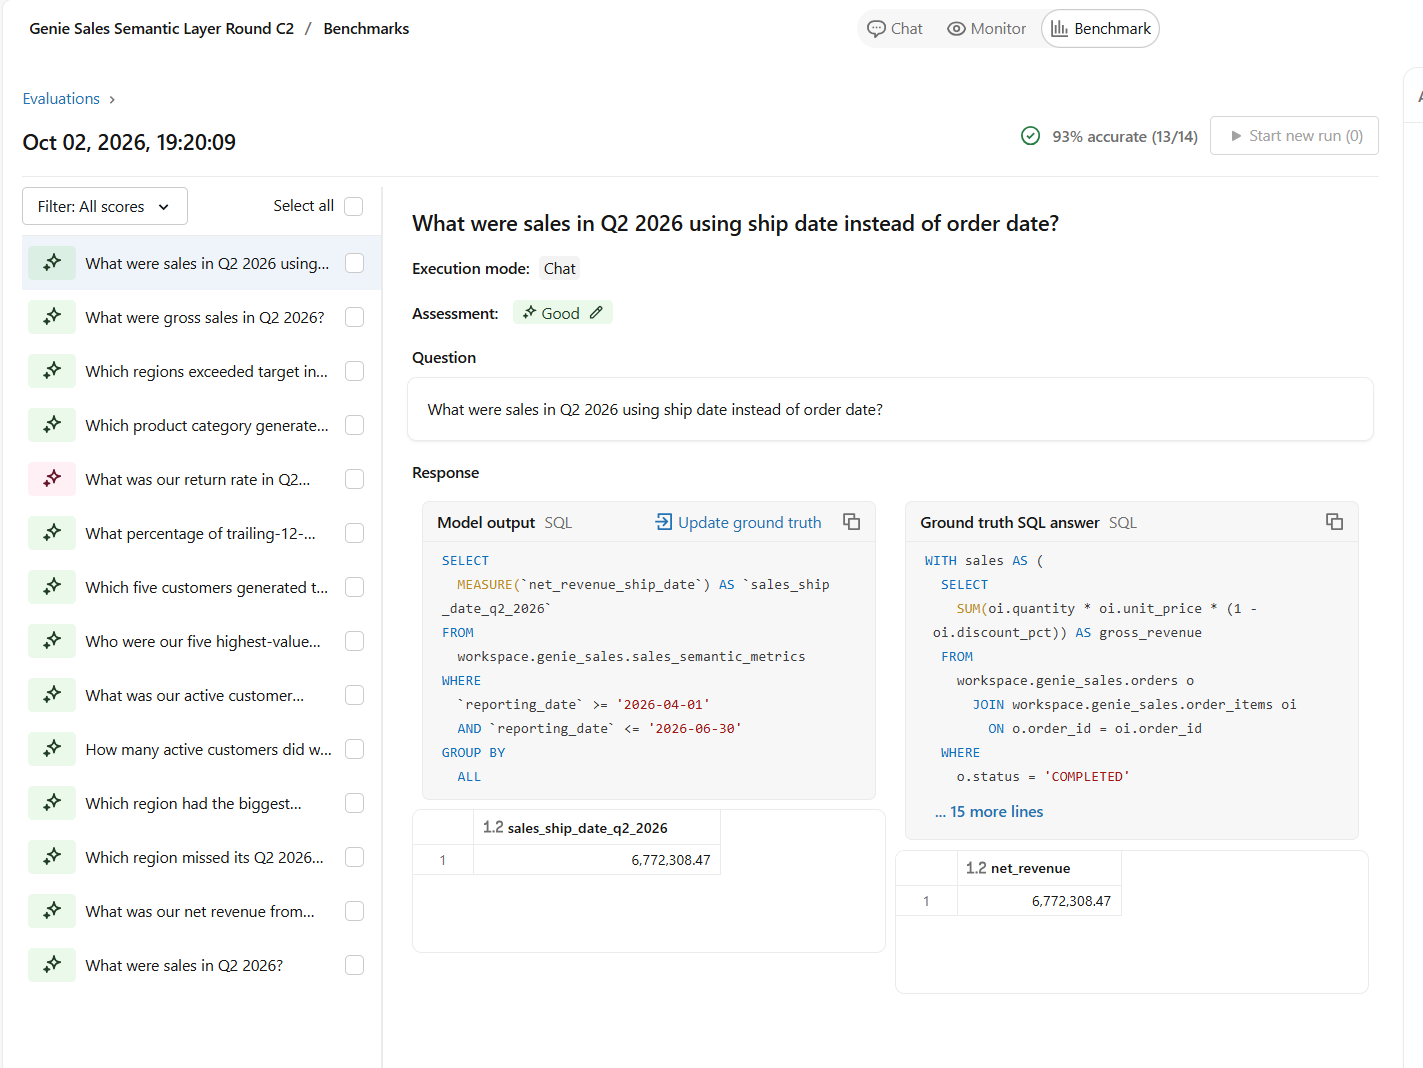
Compared with Round B, the official benchmark moved from 79% to 93%.
More importantly, the serious return-rate SQL error from Round B disappeared. Genie queried the governed return_rate measure instead of constructing another multi-table calculation.
Why was the correct return-rate answer still marked wrong?
Databricks rejected the final return-rate answer because Genie and the ground truth represented the same percentage differently. Genie returned 0.041064, which equals 4.1064% and rounds to 4.11%. The benchmark ground truth returned 4.11, so the evaluator treated the two result sets as different.
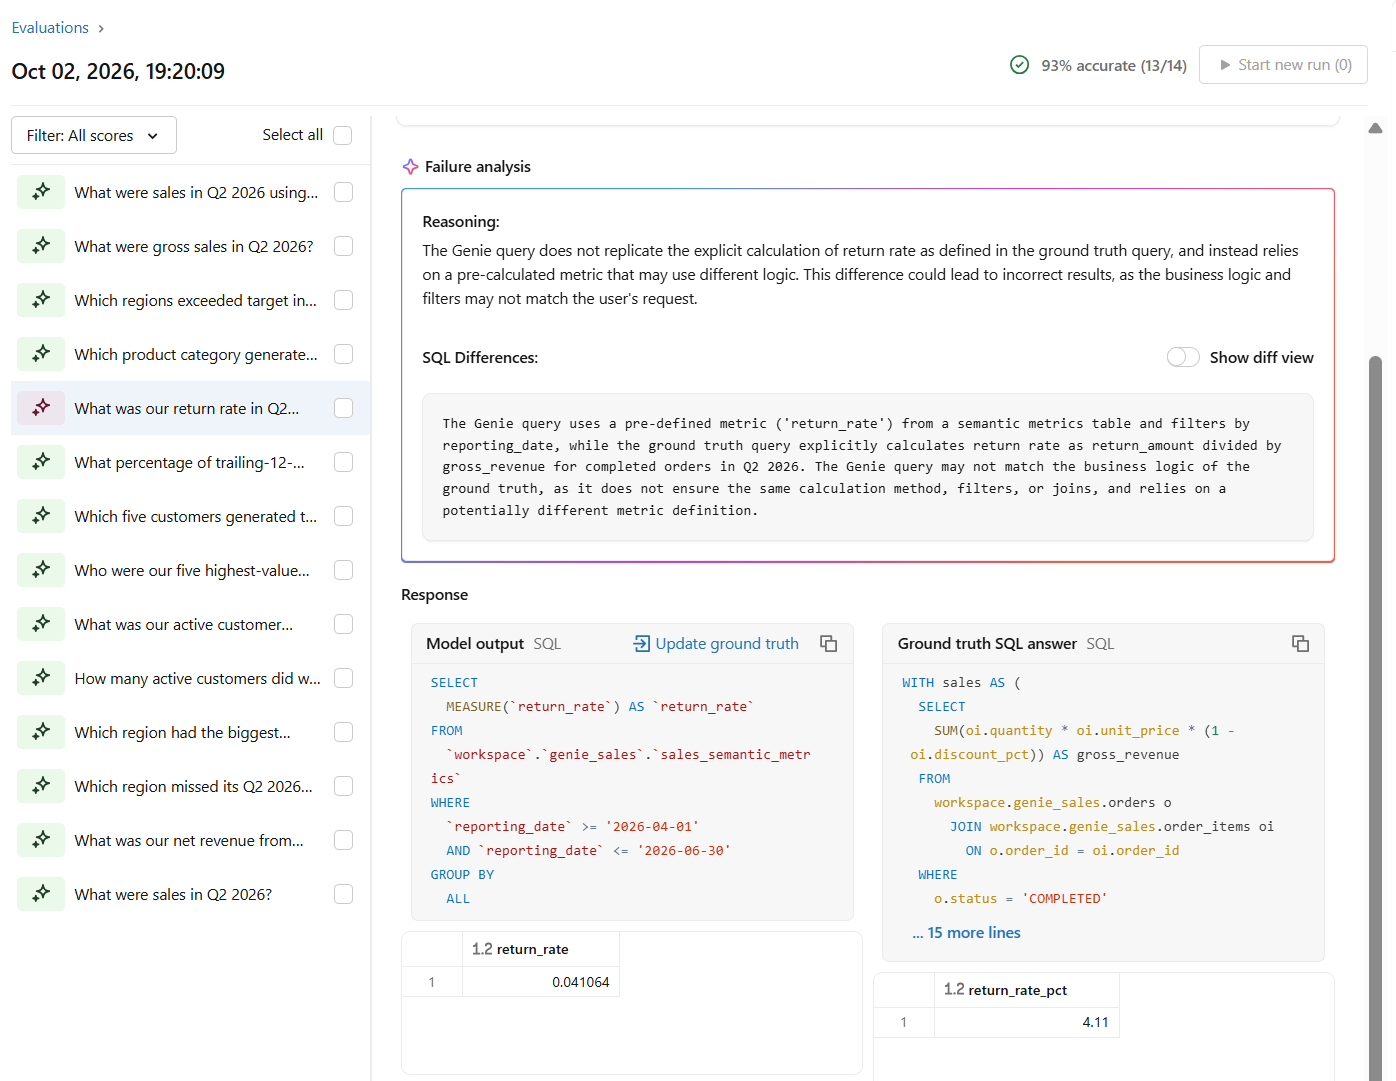
I therefore report both numbers rather than replacing one with the other. Databricks’ official score is 13 of 14, or 93%. My manual business review is 14 of 14 because the remaining rejected value represents the correct return rate.
Can a semantic layer improve text-to-SQL reliability?
A semantic layer can improve text-to-SQL reliability by removing repeated business calculations from model-generated SQL. In this experiment, moving return rate into the semantic layer removed the join-grain failure that had produced 56.89% even though Genie had understood the written formula correctly.
The semantic layer did not eliminate all possible errors. My own precision and customer-activity mistakes were semantic-model errors rather than generated-SQL errors. The location of the risk changed.
Do governed metrics stay correct when users group them differently?
They did in the grouping tests I ran. The governed return-rate measure returned the same independently validated values when grouped by sales region and by product category. That matters because a reusable business metric should remain correct when users change the dimensional breakdown rather than only at the total level.
By region, Q2 return rates were Central 2.85%, East 4.38%, South 3.46% and West 5.76%. These matched my direct Metric View validation.
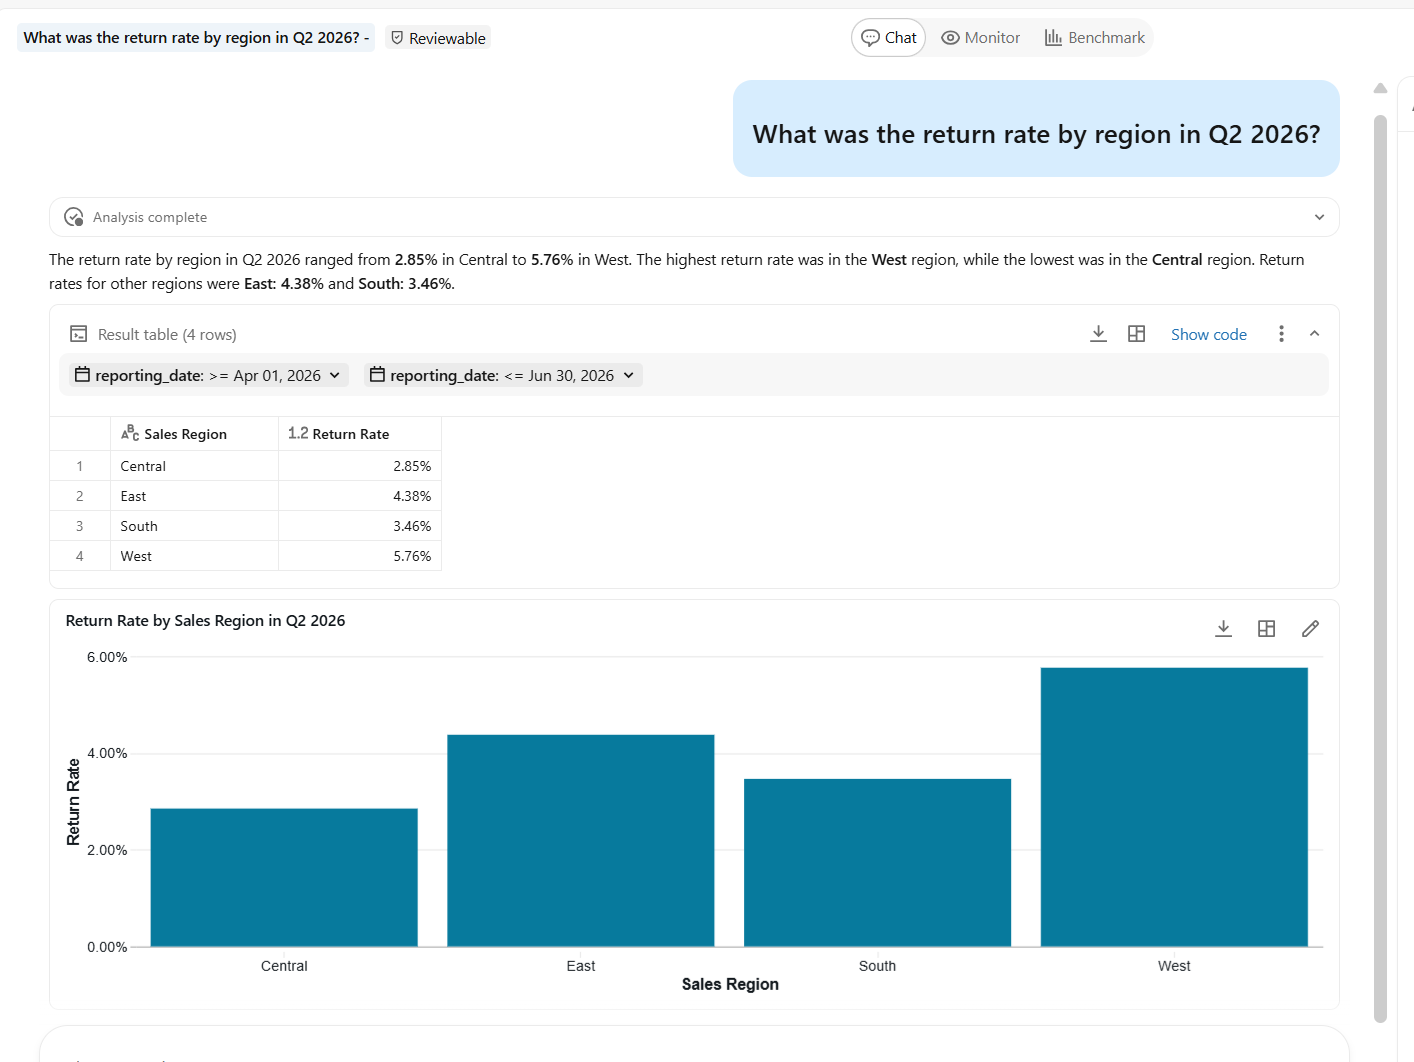
By product category, the results were Collaboration 5.00%, Analytics 4.89%, Services 4.53%, Productivity 4.26%, Security 3.77% and Infrastructure 1.87%. These also matched the direct semantic-layer queries.
Does a semantic layer make business synonyms consistent?
It did in this test. “What were sales in Q2 2026?” and “What was net revenue in Q2 2026?” both returned exactly $6,948,098.86 in separate fresh chats. The semantic metadata mapped “sales” and “revenue” to the governed net-revenue measure instead of relying on a repeated prompt instruction.
Does a semantic layer solve ambiguous questions?
No. A semantic layer can govern what a metric means, but it does not automatically decide what an ambiguous user phrase such as “best” or “performed best” is supposed to mean. Genie passed two of my three ambiguity tests and silently chose a metric in the third.
When I asked, “Who are our best customers?”, Genie asked which metric should define “best.” When I asked, “How much did sales grow?”, it asked which periods to compare.

The third ambiguity test failed. I asked, “Which region performed best in Q2 2026?” Genie chose net revenue, returned South and only afterward offered target attainment or gross revenue as alternate interpretations.
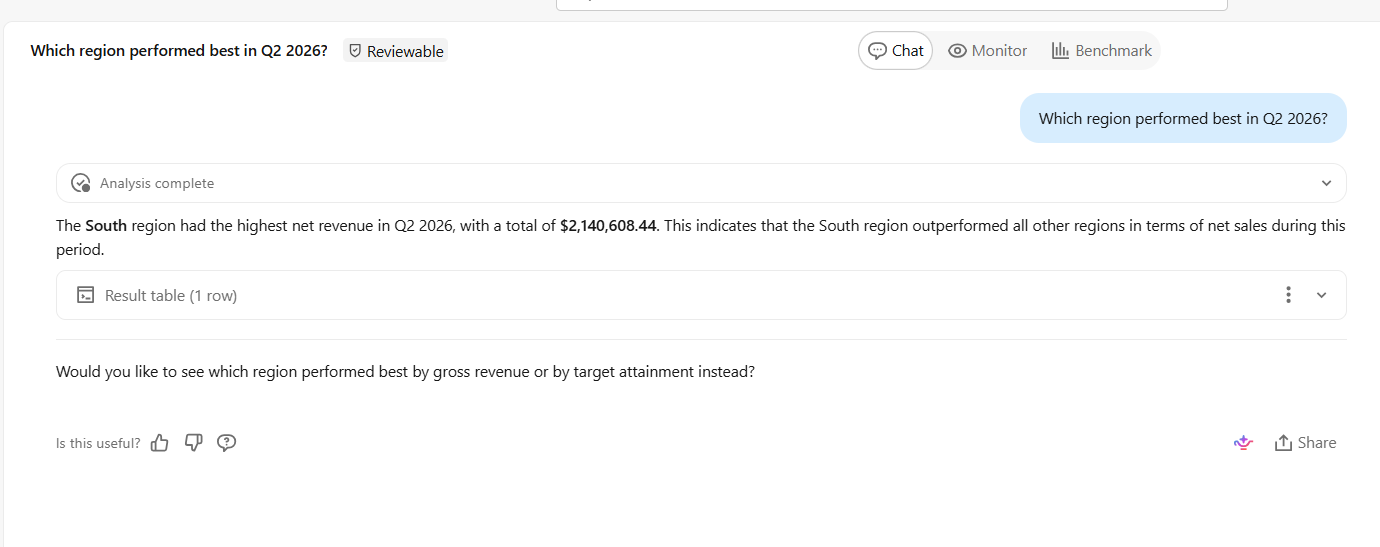
A semantic layer can define what net revenue means. It cannot automatically decide whether “best” means revenue, growth, margin or target attainment.
Can a semantic layer detect a false premise?
Genie did in this experiment. When I asked why sales fell in June, it checked the governed data and found that June net revenue had actually increased by $641,399.10 compared with May. It rejected my false premise instead of inventing an explanation for an event that had not occurred.

Can a semantic layer explain why a business metric changed?
A semantic layer can show where a metric changed, but it cannot establish a real-world cause without additional evidence. Genie could decompose a June-to-July revenue decline across region, segment and product category, but the available dataset did not contain evidence about pricing, competition, promotions, customer behavior or other external causes.
I asked, “Why did net revenue fall from June to July 2026?” Genie showed that Enterprise declined by $361,214.39, East declined by $127,112.68 and Services declined by $76,263.61.
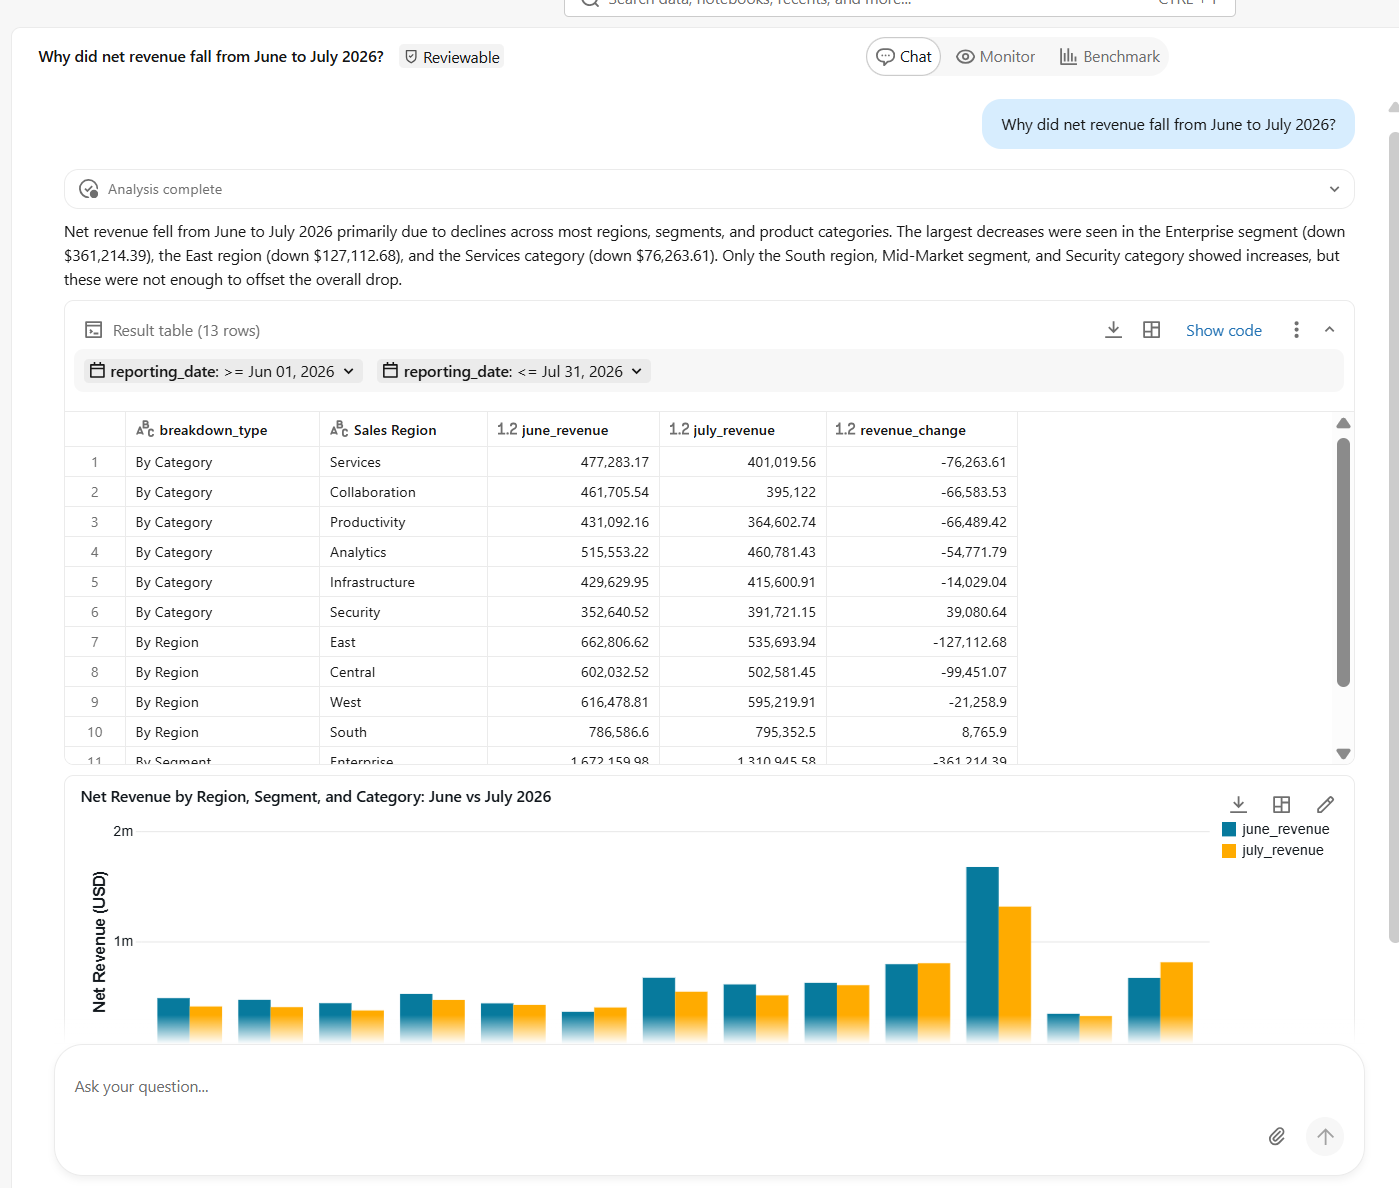
I would treat this as a partial pass on causal restraint. Genie stayed within observable data, but the phrase “primarily due to” can still make a descriptive breakdown sound causal.
Region, segment and category explain where the arithmetic changed. They do not prove why customers behaved differently. Answering that would require evidence such as pricing changes, promotions, outages, competitor activity, customer feedback or other business events.
What should live in a semantic layer and what should stay in the prompt?
Stable, reusable business calculations belong in the semantic layer, while conversation rules that depend on user intent still belong in instructions or clarification logic. True causal claims need additional evidence rather than either a metric definition or a prompt rule.
| Context | Where I put it | Examples |
|---|---|---|
| Reusable metric math | Metric View | Net revenue, return rate, target attainment, target shortfall |
| Reusable business vocabulary | Metric View metadata | “Sales” as a synonym for net revenue |
| Business activity grain | Purpose-built semantic source | Completed orders for active-customer calculations |
| User-intent ambiguity | Genie instructions | Ask what “best” means |
| Actual business causality | Additional evidence | Campaigns, pricing events, outages and customer behavior |
Does a semantic layer eliminate AI errors?
No. A semantic layer can reduce repeated interpretation and SQL-generation errors, but defects can move into the semantic model, its source grain or the agent configuration. This experiment produced examples of all three: a rounding issue, a customer-activity grain issue and an incorrectly attached semantic source.
The practical implication is that semantic definitions need tests, owners and change control just like other production data logic.
Does a semantic layer replace human review?
No. Human review was still needed to separate a real business failure from an evaluator representation mismatch and to judge ambiguous or causal language. The official benchmark said 93%, while manual review identified the remaining return-rate rejection as numerically equivalent to the expected 4.11%.
Human review also caught the “performed best” ambiguity failure even though the South-region answer was mathematically valid under the metric Genie silently selected.
What are the limits of this semantic layer AI experiment?
This is a controlled benchmark on fictional data, not a universal accuracy claim for Databricks Genie or semantic layers. It used one dataset, 14 deterministic benchmark questions, three ambiguity tests and a small set of stress tests. Different schemas, semantic designs, models and platform releases can produce different results.
The manual 100% classification also has a specific meaning. Databricks officially accepted 13 of 14 answers. I classified the fourteenth as business-correct because 0.041064 and 4.11% are the same return rate after percentage conversion and rounding.
I also ran an Agent-mode benchmark during development, but I excluded that score from the main A/B/C comparison because Agent and Chat use different evaluation methods.
Semantic layer AI FAQ
What is a semantic layer for AI?
A semantic layer for AI stores governed business measures, dimensions and metadata so an AI system can query established business definitions instead of rebuilding them from raw tables. It gives the AI a reusable business vocabulary and calculation layer before natural-language questions are translated into queries.
Can a semantic layer improve AI accuracy?
It can improve accuracy when questions depend on reusable business logic. In this experiment, Databricks’ official benchmark increased from 79% with prompt-based definitions to 93% with governed Metric Views, while the serious return-rate calculation failure from the prompt-based round disappeared.
Can a semantic layer improve text-to-SQL?
It can reduce the amount of business logic a text-to-SQL system must generate itself. The return-rate calculation in this experiment moved from a wrong generated join pattern to a governed measure that returned the correct business value.
What should a semantic layer define?
Stable business metrics, dimensions, calculation rules, synonyms and important grain relationships are strong candidates for a semantic layer. Definitions that consistently change the meaning of business numbers are usually easier to test and govern outside an individual AI prompt.
Should business metrics live in AI prompts?
Reusable metric calculations are generally safer when they are defined and tested outside the prompt. Prompts can still carry conversational rules and context, but repeatedly asking a model to translate the same business formula into SQL creates another opportunity for inconsistency.
Does a semantic layer prevent hallucinations?
No. A semantic layer can constrain metric interpretation, but an AI system can still misread an ambiguous question or imply more than the available data proves. The failed “best-performing region” test in this experiment is one example.
Does a semantic layer replace human review?
No. Human review remains useful for evaluator mismatches, ambiguous questions, semantic-model defects and claims that go beyond what the data supports. Governed metrics reduce some classes of error, but they do not remove the need for judgment.
Can a semantic layer explain why sales changed?
It can describe where a change occurred, but it cannot establish a real-world cause unless supporting evidence exists in the available data. Region or product breakdowns can explain the arithmetic of a decline without proving why customers changed their behavior.
Official Databricks learning resources
Agent metadata, display names and synonyms
Genie Agent testing and benchmarks
What should I test next?
The next useful test is semantic context beyond individual measures: fiscal calendars, certified business concepts, account hierarchies and event data that can support deeper diagnostic questions. I also want to test whether the same governed definitions remain consistent across dashboards, SQL users and external AI agents.
If you have seen an AI analytics tool return the right number for the wrong reason, or a convincing answer built on the wrong grain, add the failure pattern in the comments. Those cases are more useful to test than another polished demo.
This experiment connects closely to the operating model I discuss in The Data-Driven Executive and the implementation discipline in AI to ROI for Business Leaders.