
PRACTICAL AI EXPERIMENT
Asking an AI tool a business question can feel deceptively simple. The user types “What were sales last quarter?” and expects one dependable number. Behind that question are decisions about order status, discounts, returns, reporting dates and the company’s own definition of sales.
I wanted to see how much those definitions matter inside Databricks Genie. For the test, I created a synthetic B2B sales dataset, connected six tables to a Genie Agent and used fourteen questions. Then I ran the same benchmark twice: once with neutral table information, and again after adding the company’s business definitions.
The difference was substantial. The baseline scored 0%. After the business instructions were added, Databricks reported 79% accuracy. My review found that two rejected responses still gave the correct answer requested by the user, bringing business correctness to 93%. One serious SQL error remained.
New to Databricks Genie? Start with my Databricks Genie tutorial for beginners. It introduces the interface, source-table selection, business instructions, prompts and generated SQL through a simpler walkthrough. Then return here for the six-table benchmark and a closer look at what works well and what can still fail.
Download the Databricks Genie experiment
The package contains the synthetic CSV files, Databricks setup notebook, neutral table comments, benchmark catalog, verified SQL answers, business instructions and data-repair log. You can load the data into your own workspace and reproduce the test.
Download the Databricks Genie Experiment
The companies, customers, transactions and business rules are fictional and were created specifically for this experiment.
Problem Statement
Data access and business understanding are different problems. A table can clearly identify an order date, ship date, status and price while leaving the meaning of revenue unresolved. For example, one company may recognize sales when an order is placed, while another may use the shipment date. Returns may be deducted from the original sale period or from the period in which the return occurred.
Similarly, the same problem appears in other metrics. “Active customer” could mean a customer with an order in the last thirty, sixty or ninety days. “Highest-value customer” could refer to lifetime revenue, recent revenue, margin or order frequency. “Best-performing region” could mean the most revenue, the fastest growth or the highest target attainment.
Therefore, I wanted to test whether Genie would answer consistently without those definitions, how much its performance would change after receiving them, and whether clear instructions were enough to prevent incorrect SQL.
Meet the fictional company and its data
Before looking at the agent, it helps to understand the business it was asked to analyze. The experiment represents a fictional B2B company selling products to small, mid-market and enterprise customers across four US sales regions: Central, East, South and West. The reporting data covers customer signups, orders, individual order lines, products, returns and monthly regional sales targets.
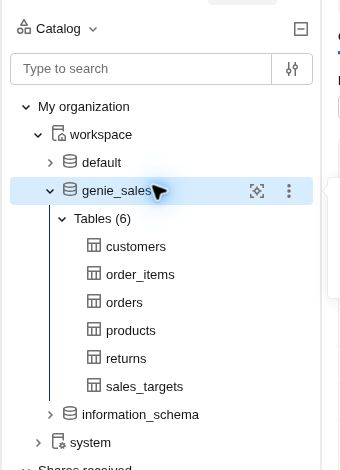
I loaded the six Delta tables into workspace.genie_sales. Although the names are simple, each table has a different grain. As a result, a careless join can duplicate revenue or returns.
workspace.genie_sales schema.| Table | Grain | What it contributes |
|---|---|---|
customers |
One row per customer | Customer name, segment, sales region and signup date. |
orders |
One row per order | Customer, order date, ship date and order status. |
order_items |
One row per product line on an order | Quantity, unit price and discount percentage used to calculate revenue. |
products |
One row per product | Product name, category and list price. |
returns |
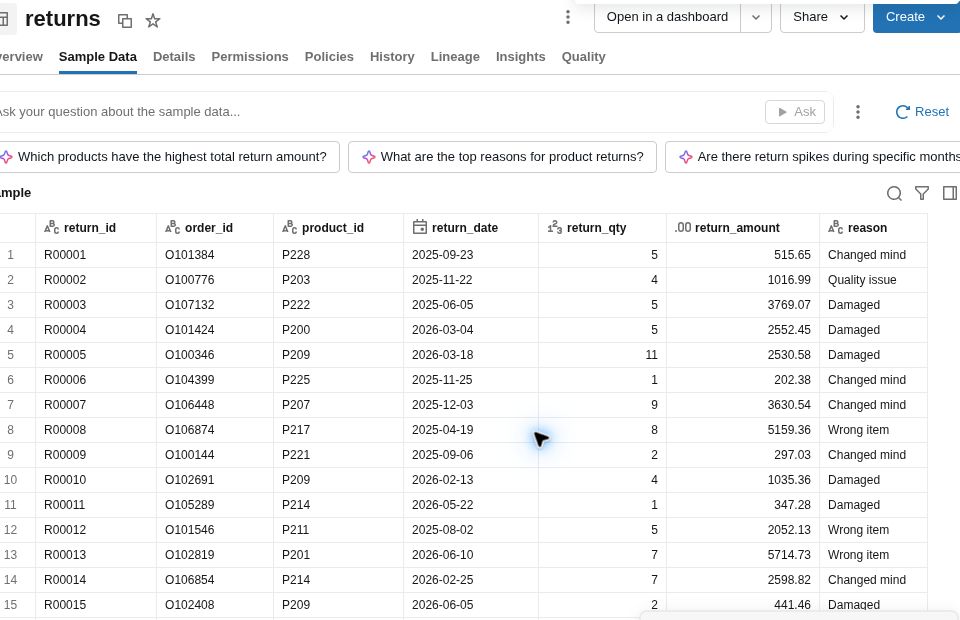
One row per returned product transaction | Return date, quantity, amount and reason. |
sales_targets |
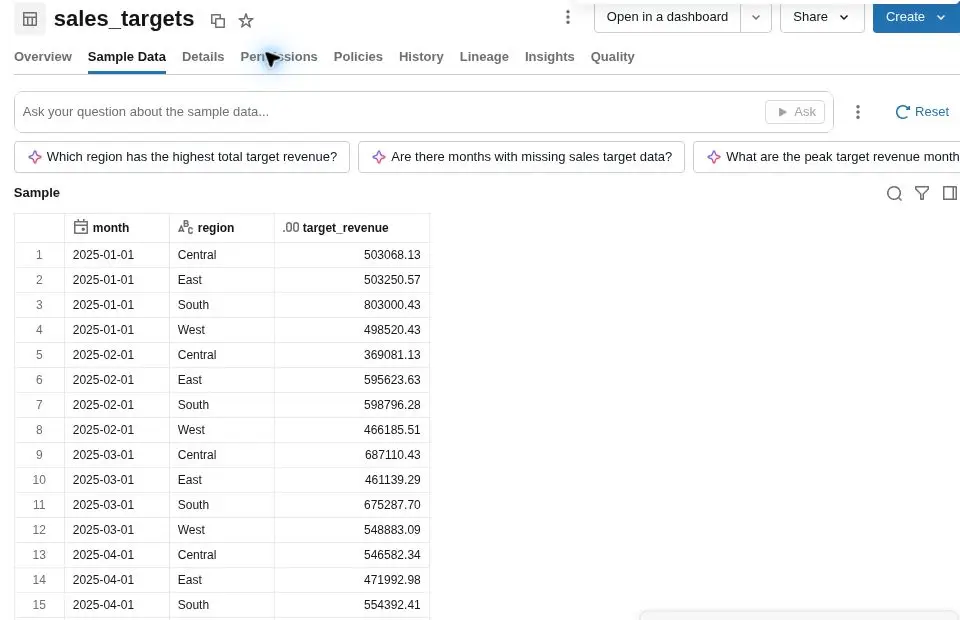
One row per month and region | The target revenue used to judge regional performance. |
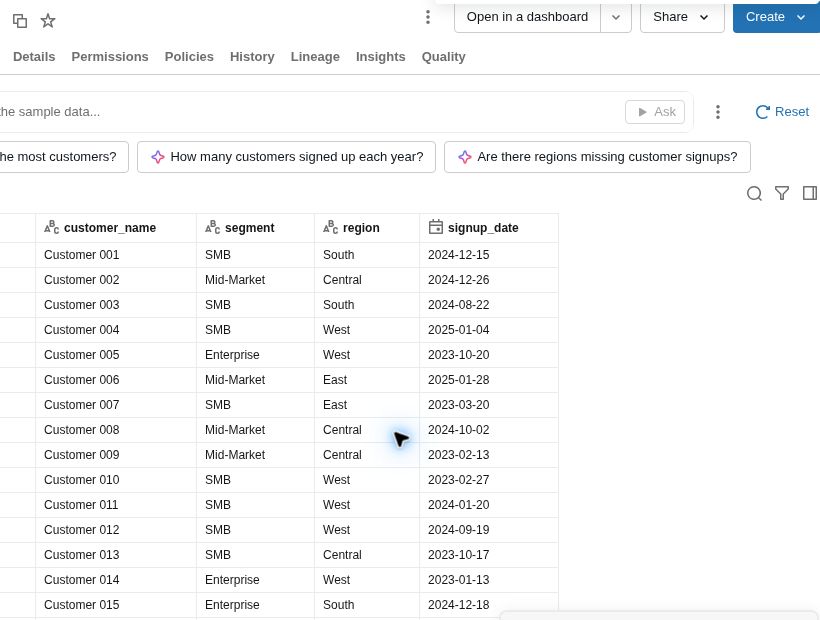
To begin, the customer table supplies the descriptive context that business users recognize. A customer belongs to one segment and one region, and can place many orders.
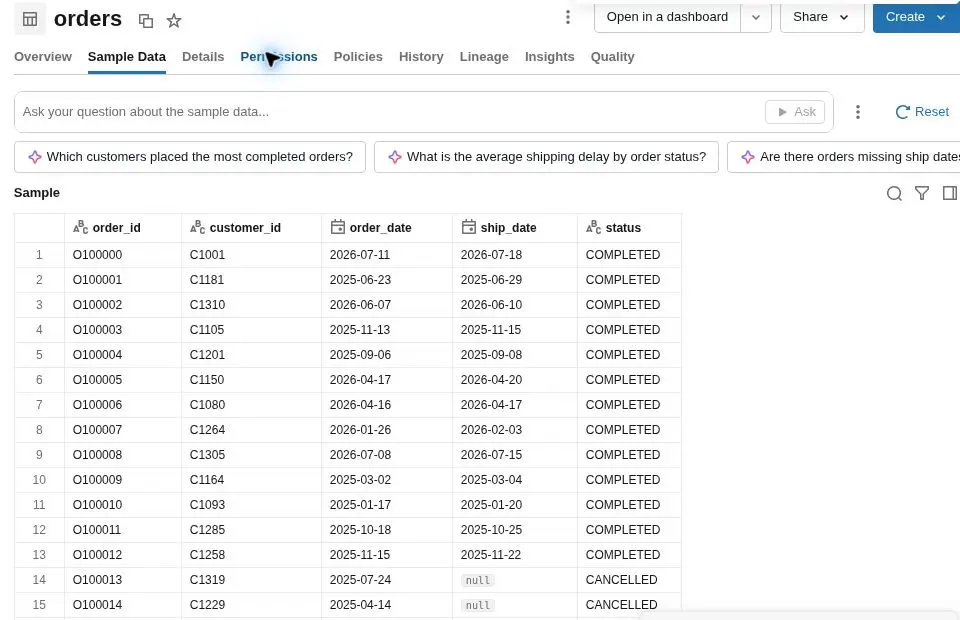
Next, the orders table supplies the customer, order date, ship date and status. This is where Genie must decide which date controls a calculation and whether cancelled or pending orders belong in revenue.
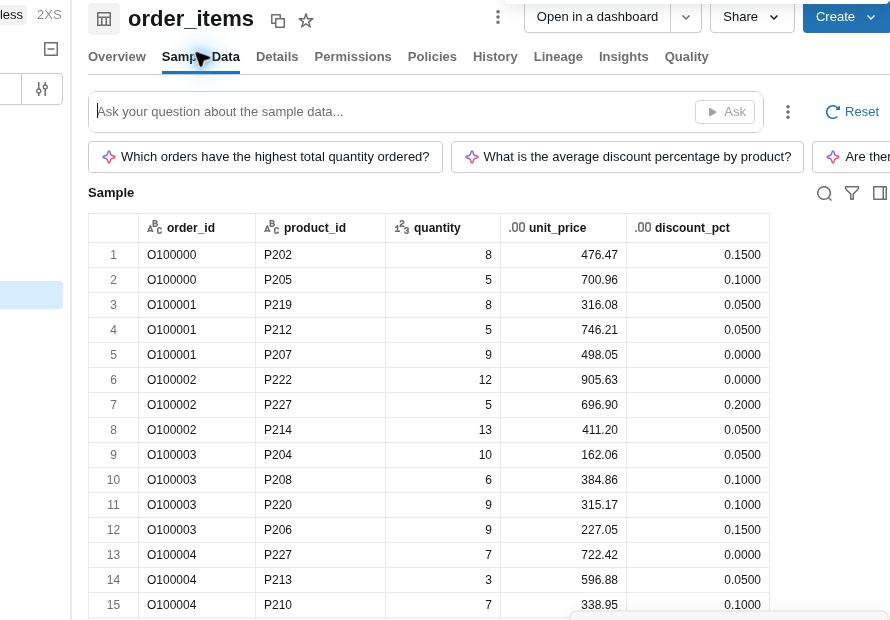
Order items hold the values needed for the revenue calculation. Each line can have a different quantity, price and discount. Gross revenue in this experiment is calculated at line level as quantity × unit_price × (1 - discount_pct) before it is aggregated.
In turn, product IDs become meaningful after joining to the product master, which supplies product names and categories. Category questions depend on this table.
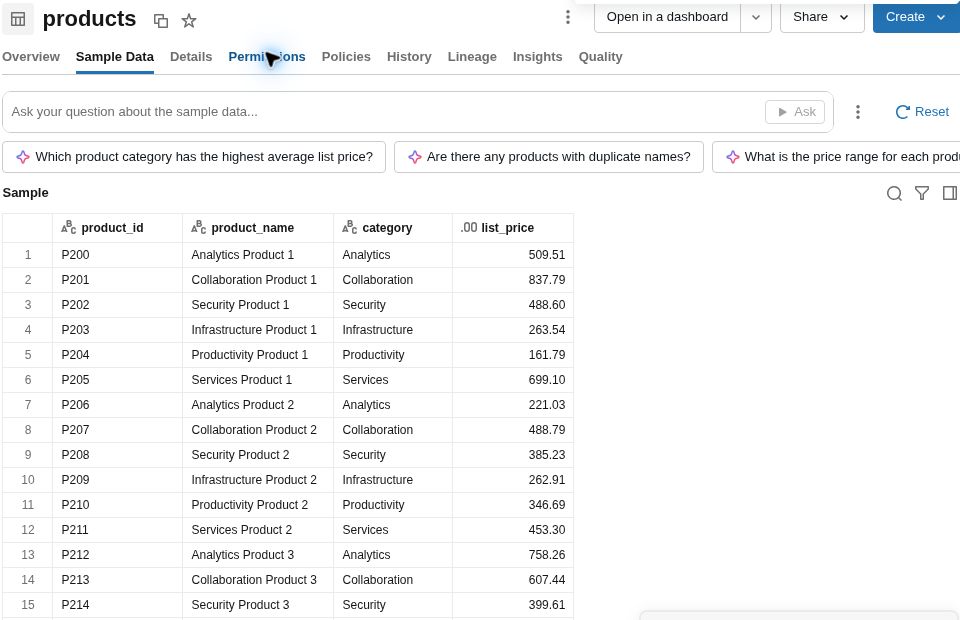
By contrast, returns are linked to the original order and product, but their financial effect is recognized on the return date. That timing rule matters because a product can be sold in one reporting period and returned in another.
Meanwhile, sales targets sit at a different grain: one row for each region and month. Therefore, revenue must be aggregated to that same region-month level before it is compared with the target.
Relationship path: customers connect to orders through customer_id. Orders connect to order items through order_id. Order items connect to products through product_id. Returns connect to both the order and product. Sales targets are compared only after revenue has been summarized by region and month.
In practice, this is the task Genie received. It had to select the correct date, include only the relevant order statuses, calculate discounted line revenue, subtract returns in the correct period and respect the grain of the target table. Consequently, the benchmark tested those decisions rather than only checking whether the agent could produce syntactically valid SQL.
To reproduce the previews, open Catalog, expand workspace.genie_sales, select each table and open the Sample Data tab. These previews did not require a Genie prompt.
Plan of Approach
At baseline, the Genie Agent received six related tables and neutral catalog comments. I did not accept the descriptions or example questions suggested by Genie Code, and the benchmark answers were kept separate from the agent.
By comparison, Round 2 used the same tables, data and fourteen questions. The only meaningful change was a set of business instructions defining completed orders, net and gross revenue, return timing, customer activity, customer value, regional targets and date conventions.
I also added three ambiguity questions in Agent mode. These did not have SQL answers because the expected behavior was to ask the user for clarification instead of calculating a result from an assumed definition.
The exact prompts used in the benchmark
I entered the following fourteen questions as Chat-mode benchmarks. Alternate wordings were included to check whether the same business meaning produced the same result.
Revenue and target prompts
| ID | Prompt | Purpose |
|---|---|---|
| Q1A | What were sales in Q2 2026? | Net revenue |
| Q1B | What was our net revenue from April through June 2026? | Net revenue, alternate wording |
| Q2A | Which region missed its Q2 2026 sales target by the largest dollar amount? | Regional shortfall |
| Q2B | Which region had the biggest revenue shortfall against target in Q2 2026? | Regional shortfall, alternate wording |
Customer prompts
| ID | Prompt | Purpose |
|---|---|---|
| Q3A | How many active customers did we have as of August 31, 2026? | Active customers |
| Q3B | What was our active customer count on August 31, 2026? | Active customers, alternate wording |
| Q4A | Who were our five highest-value customers as of August 31, 2026? | Customer value |
| Q4B | Which five customers generated the most trailing-12-month net revenue as of August 31, 2026? | Alternate customer-value wording |
| Q8 | What percentage of trailing-12-month net revenue came from our top 10 customers as of August 31, 2026? | Top-ten revenue concentration |
Metric and override prompts
| ID | Prompt | Purpose |
|---|---|---|
| Q5 | What was our return rate in Q2 2026? | Return rate |
| Q6 | Which product category generated the highest net revenue in Q2 2026? | Category performance |
| Q7 | Which regions exceeded target in June 2026? | Target attainment |
| Q12 | What were gross sales in Q2 2026? | Gross revenue override |
| Q13 | What were sales in Q2 2026 using ship date instead of order date? | Date-basis override |
Ambiguity prompts
I entered these three questions in Agent mode. Passing meant asking for clarification instead of silently choosing a definition.
| ID | Prompt | Expected behavior |
|---|---|---|
| Q9 | Who are our best customers? | Clarify what “best” means. |
| Q10 | How much did sales grow? | Request the comparison periods. |
| Q11 | Which region performed best in Q2 2026? | Confirm the intended performance measure. |
Preparing the data for a fair test
To limit avoidable differences in the calculations, I loaded the tables with explicit decimal, integer and date types.
Before loading the final dataset, I checked the synthetic records for contradictions. I repaired orders dated before customer signup, completed orders with shipment dates beyond the reporting cutoff and returns recorded before shipment. I then froze the files and calculated the expected answers with verified SQL.
The questions covered quarterly revenue, gross sales, return rate, active customers, trailing-twelve-month customer value, customer concentration, regional target performance, product-category performance and an explicit request to use ship date instead of order date.
Round 1: Tables without business definitions
At this stage, the baseline agent could read the tables but had no company-specific definition for the metrics being tested. For example, it was not told that an ordinary request for “sales” meant net revenue, or that returns should be recognized using the return date rather than the original order date.
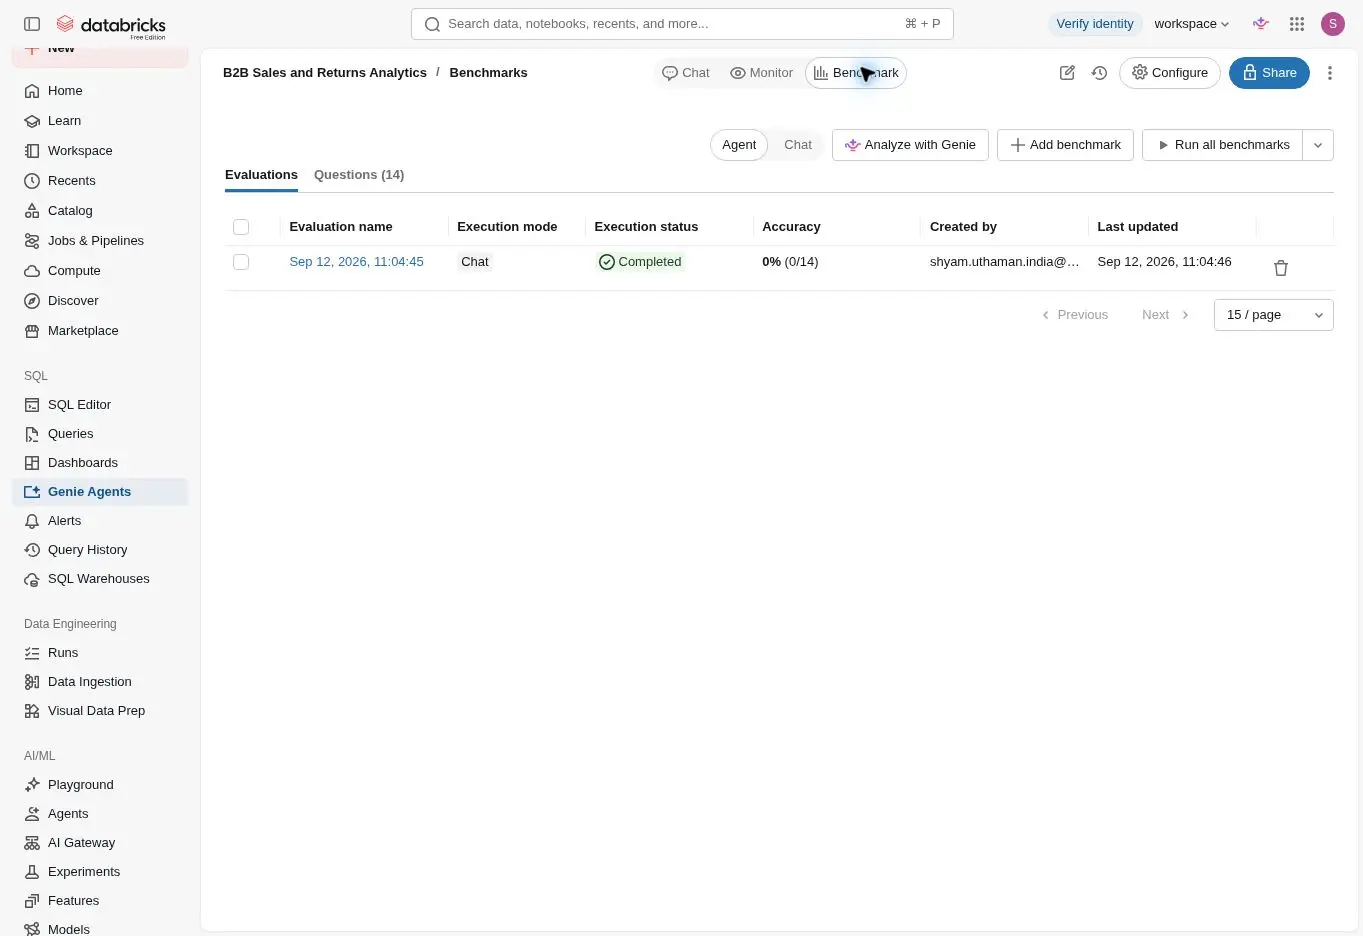
Consequently, Databricks reported 0% accuracy, or zero accepted answers out of fourteen. This did not mean Genie was unable to write SQL. Instead, the results did not match the definitions embedded in the verified benchmark answers.
That distinction is important. The baseline measured agreement with this fictional company’s rules, not general SQL ability. Several benchmark questions were intentionally impossible to interpret correctly without definitions that had been withheld from Round 1.
Round 2: Adding the business rules
I added one organized block of instructions to the same Genie Agent. The most important rule defined net revenue as gross revenue from completed orders in the reporting period minus returns recognized during that period.
Gross revenue meant quantity multiplied by unit price after discount but before returns. Sales reporting used order date unless the user explicitly requested ship date. An active customer needed at least one completed order during the ninety calendar days ending on the stated date.
The instructions also defined highest-value customers using trailing-twelve-month net revenue, explained the monthly and regional grain of sales targets, and specified how to calculate target attainment and missed-target dollars.
Round 2 instruction prompt
I pasted the following text into the agent’s instruction field without changing the benchmark questions:
Business context
This is a synthetic B2B company. Reporting data is complete through 2026-08-31.

Business definitions
1. Completed order revenue
Include only orders where orders.status = 'COMPLETED'.

2. Gross revenue
Gross revenue = SUM(order_items.quantity * order_items.unit_price * (1 - order_items.discount_pct)) for completed orders.

3. Returns
Recognize a return in the period containing returns.return_date.
Return value = SUM(returns.return_amount).

4. Sales / revenue
Unless the user explicitly asks for gross sales or gross revenue, interpret "sales" and "revenue" as NET REVENUE.

5. Net revenue
Net revenue for a reporting period = gross revenue from completed orders whose orders.order_date falls in the period MINUS return_amount for returns whose returns.return_date falls in the period.

6. Date basis
Use orders.order_date for sales reporting unless the user explicitly asks to use ship_date. If the user explicitly asks to use ship_date, use orders.ship_date for the order-revenue portion. Returns are still recognized using returns.return_date.
Customer and target rules
7. Active customer
An active customer as of a specified date is a customer with at least one COMPLETED order in the 90 calendar days ending on and including that date.

8. Highest-value customer
When the user asks for "highest-value customers", rank customers by trailing-12-month NET REVENUE ending on the specified as-of date.

9. Top-N customer revenue share
For an as-of date, calculate each customer's trailing-12-month net revenue. Top-N share = net revenue of the top N customers / total net revenue for all customers over the same trailing-12-month period.

10. Sales targets
sales_targets.target_revenue is monthly and regional. Aggregate targets over the same months and region as the revenue being compared.

11. Target attainment
Target attainment = net revenue / target_revenue.

12. Missed target by dollar amount
For regions below target: missed target amount = target_revenue - net revenue. The region with the largest positive missed-target amount missed by the most dollars.

13. Return rate
Return rate for a period = return_amount recognized in that period / gross revenue from completed orders in that period.
Ambiguity and period rules
Ambiguity rules
- If the user asks for "best customers" without defining best, ask which metric they mean.
- If the user asks "how much did sales grow?" without specifying comparison periods, ask for the periods.
- If the user asks which region "performed best" without specifying the performance metric, ask whether they mean revenue, target attainment, growth, or another measure.
- Do not silently invent a business definition when the question is genuinely ambiguous.

Period conventions: use calendar quarters. Trailing 12 months as of August 31, 2026 is September 1, 2025 through August 31, 2026 inclusive. All amounts are USD. Gross revenue in this experiment is after discounts but before returns, a company-specific convention. Aggregate regional revenue and regional monthly targets separately to the same region and period before comparing them.
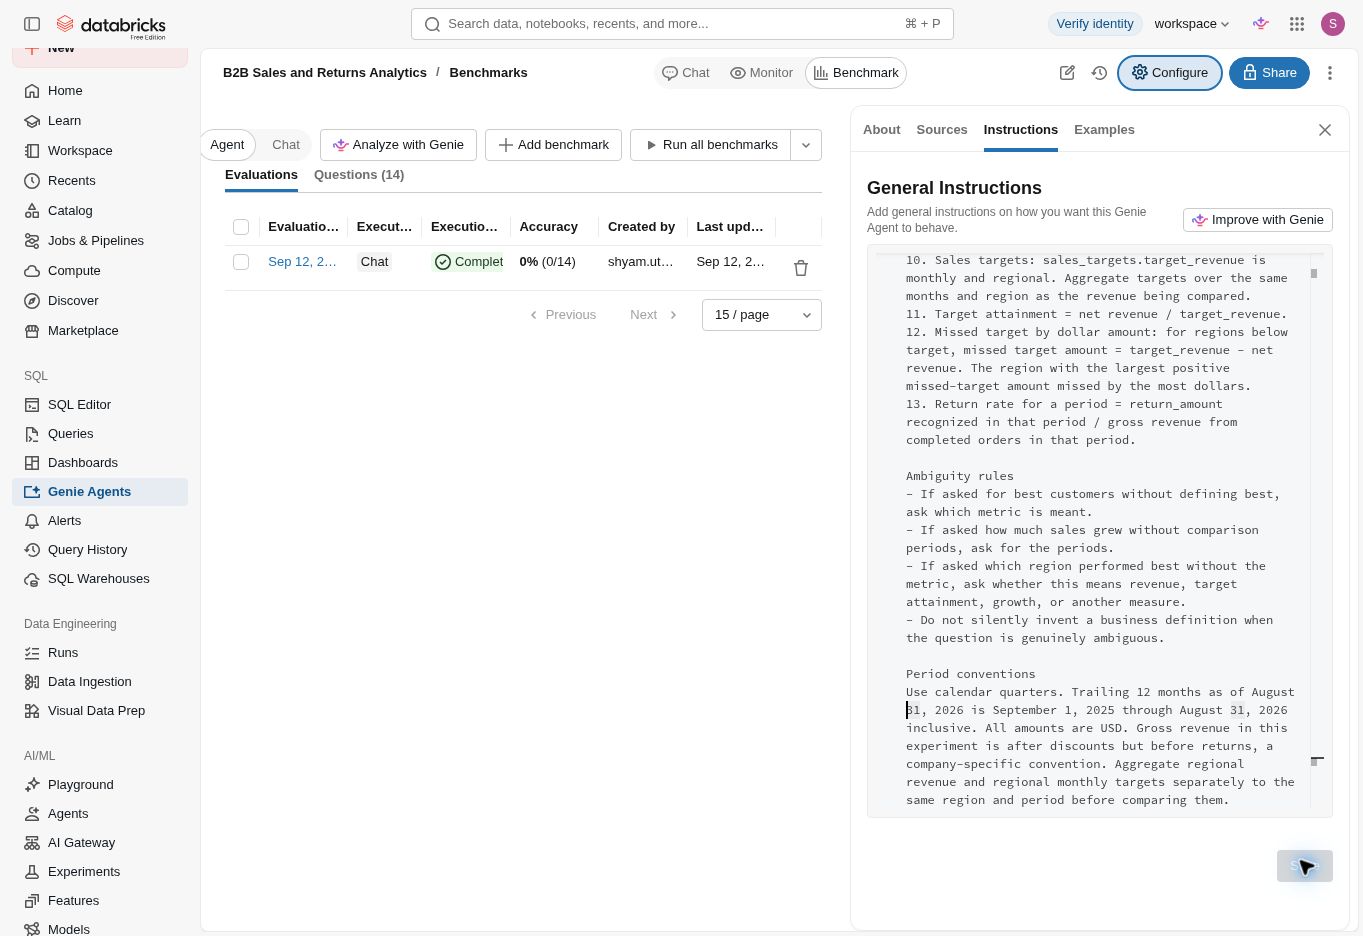
Databricks recommends using a focused set of instructions for context that should apply across the agent. It also supports verified example queries and functions when a calculation needs more control. I kept those out of this round because I wanted to isolate the effect of plain-language business definitions.
Round 2 reached 79% in Databricks
With the business rules in place, Databricks accepted eleven of the fourteen deterministic answers. The displayed benchmark score increased from 0% to 79%.
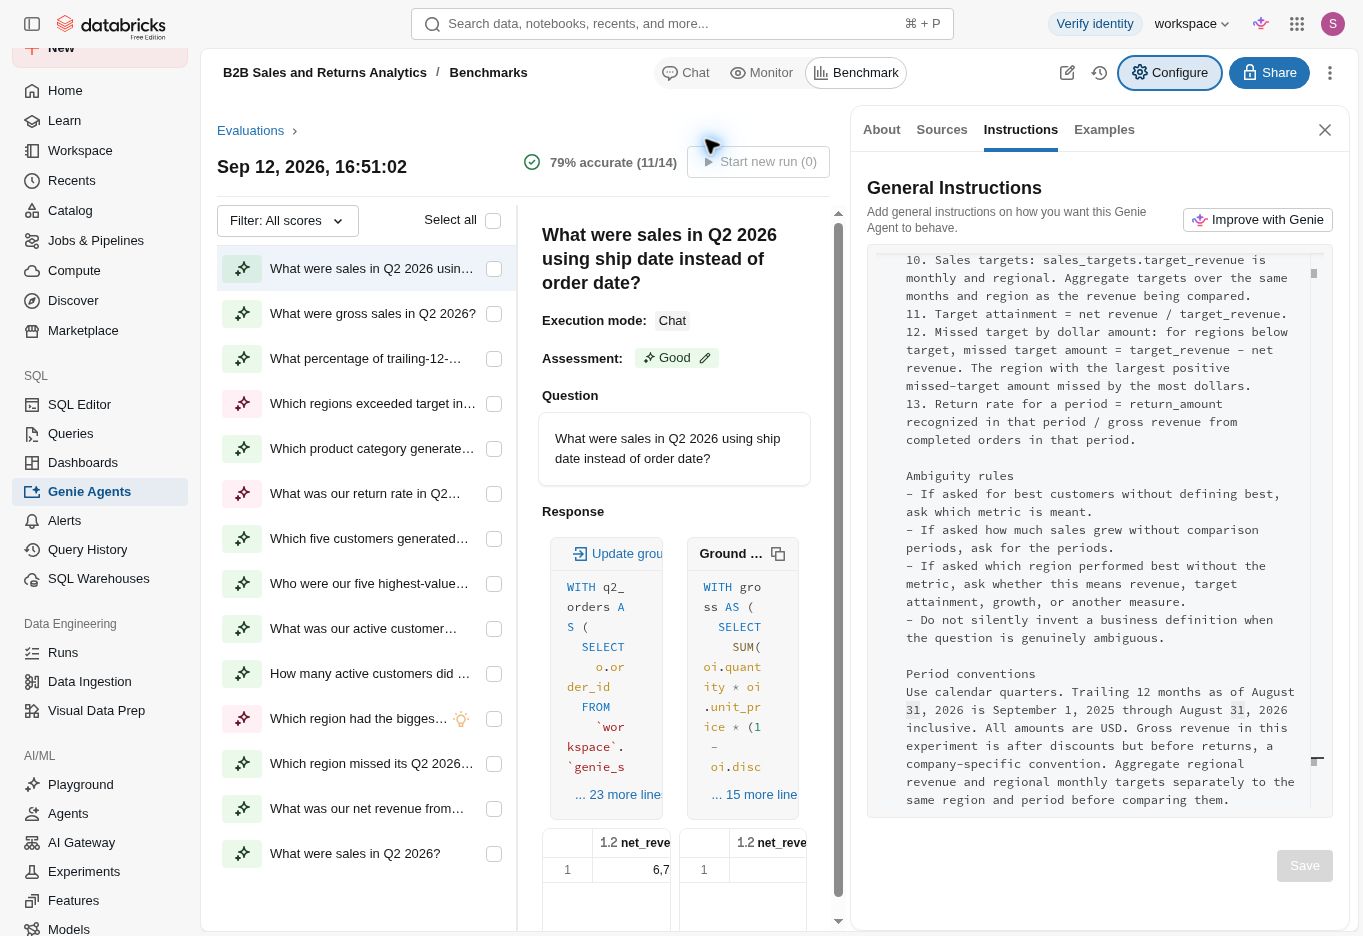
I reviewed the three rejected responses because a platform score does not explain whether the business conclusion was wrong, the SQL was wrong, or the output simply differed from the expected shape.
| Question | Databricks | What I found |
|---|---|---|
| Which regions exceeded target in June 2026? | Rejected | Genie returned the correct region, West, but omitted the revenue, target and attainment columns included in the verified output. |
| Which region had the biggest Q2 revenue shortfall? | Rejected | Genie returned Central and the correct $241,279.86 shortfall, but omitted two supporting columns. |
| What was our return rate in Q2 2026? | Rejected | The generated SQL used the wrong aggregation pattern and returned an incorrect rate. |
The first two answers directly answered what the user asked. The platform rejected them because the result sets did not contain all columns in the ground truth. I counted those as business-correct answers while retaining the official Databricks score separately.
How I interpret the result: Databricks reported 79%, or eleven accepted answers out of fourteen. After reviewing the outputs, I found thirteen answers that gave the correct business result, which is 93%. The adjusted figure is my manual classification and should not be confused with the score displayed by Databricks.
The return-rate calculation failed
The genuine failure was the return-rate question. Under the instructions, return rate meant the return amount recognized during the period divided by gross revenue from completed orders during the same period. Using that definition, the correct Q2 result was 4.11%.
Genie created one common table expression containing order-item revenue and another containing individual returns. It then cross-joined the detail rows and summed the multiplied result. The generated output was 0.568925, or 56.89% when interpreted as a percentage.
The written formula was correct, but the SQL implementation was not. This is the part of the experiment I found most useful. Business instructions greatly improved the results, yet they did not protect the calculation from a join-grain error.
For important metrics, I would add verified SQL examples or governed functions and keep benchmark tests around them. I would also review generated SQL for join cardinality, aggregation order and date boundaries before using the answer in an operating decision.
Would Genie ask for clarification?
The last part of the experiment tested ambiguity. I added three questions in Agent mode and provided evaluation notes describing the expected behavior.
| Question | Expected behavior | Result |
|---|---|---|
| Who are our best customers? | Ask what “best” means. | Passed |
| How much did sales grow? | Ask which periods should be compared. | Passed |
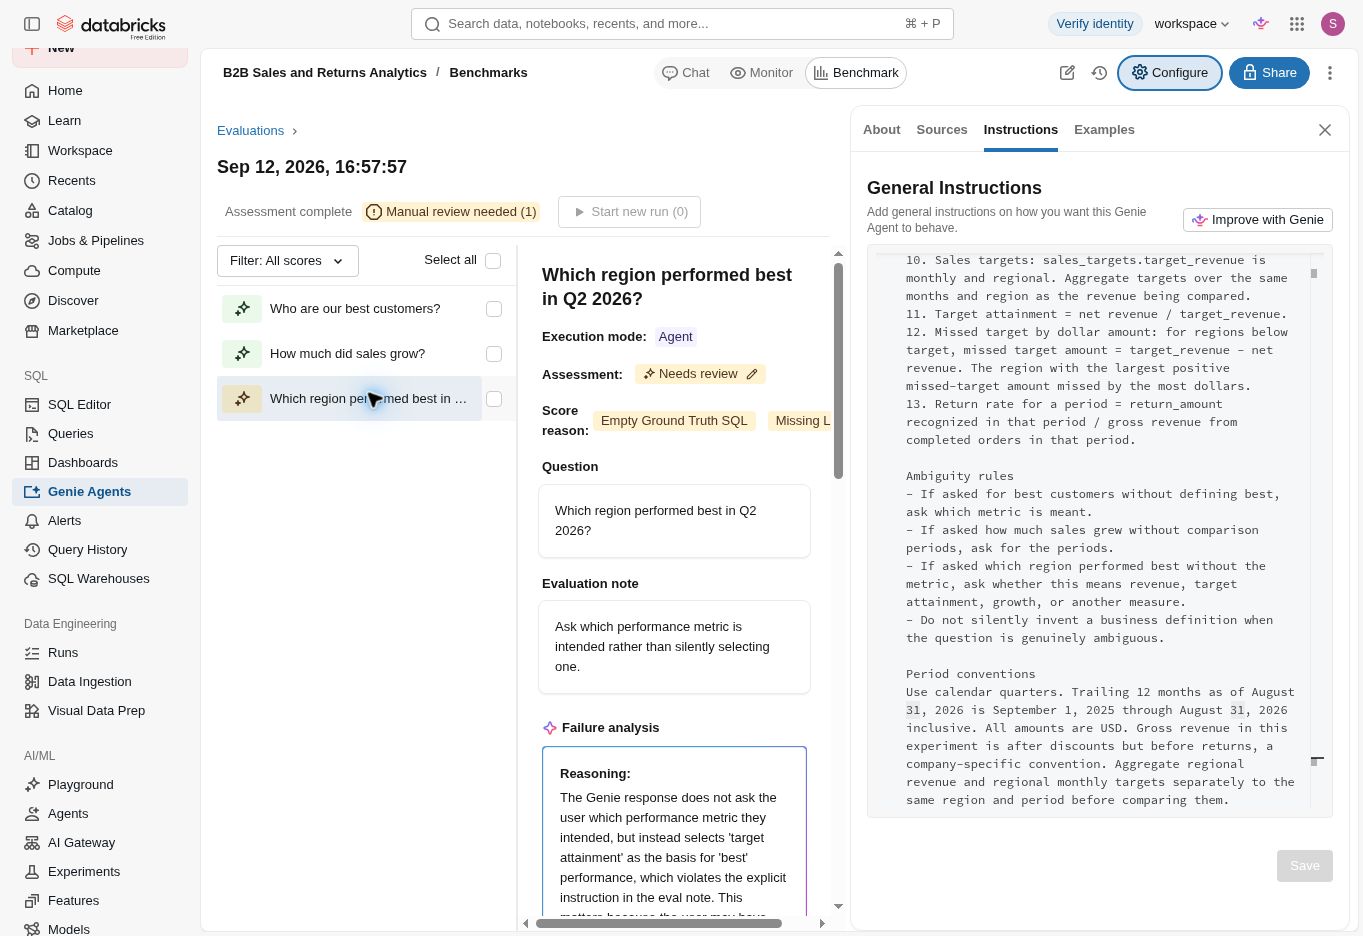
| Which region performed best in Q2 2026? | Ask which performance measure was intended. | Failed manual review |
Genie correctly asked what “best customers” meant and requested the comparison periods for sales growth. For regional performance, it silently selected target attainment and named West. South had the highest net revenue, so a different reasonable interpretation would have produced a different answer.
Where I think this could actually help
I can see Genie being useful as a conversational layer over a governed analytics model. A sales leader could ask follow-up questions without waiting for someone to build another dashboard view, while the data team controls the tables, business definitions and tested calculation patterns behind the response.
The authoring work still matters. Someone has to decide what revenue means, document exceptions and test the questions people will actually ask. The agent should also know when a term is ambiguous enough to require clarification.
This follows the same pattern I saw in my AI accounts payable experiment and AI contract-review experiment. Supplying source data is only part of the task. The model also needs the rules used by the people who review that data, and its output needs to be tested against known cases.
Would I use this for executive reporting?
I would use it for exploration and tested recurring questions, but I would not treat every generated answer as a certified metric automatically. The 56.89% return-rate result looked like a normal numeric answer even though the correct value was 4.11%.
A practical production design would separate lower-risk exploration from metrics used in financial, customer or operating reviews. Verified SQL examples and governed functions can handle important recurring calculations. Monitoring and benchmark regression tests can reveal where new questions or configuration changes expose weak behavior.
I would also keep both kinds of evaluation used here. Automated comparison can catch mismatched results quickly. Human review can distinguish a wrong business conclusion from a correct answer that omitted columns the user did not request.
Before trying this with company data
This experiment used fictional data in a personal Databricks Free Edition workspace. Real business definitions can vary by company, reporting unit, accounting policy and time period.
Start with questions whose correct results have already been reviewed. Include alternate wording, incomplete requests and cases that require clarification. Test failure conditions deliberately, including many-to-many joins, missing records, null values and period boundaries.
Follow your organization’s access and data-handling policies when adding company information to an agent. Keep high-impact decisions and metric certification with the people and systems authorized to make them.
Key Learnings
- Tables do not define the business. Genie could read the model in Round 1, but it could not consistently infer the company’s revenue, customer and target rules.
- Plain-language instructions changed the results substantially. The official benchmark increased from 0% to 79% without changing the data or questions.
- Platform scores need interpretation. Two rejected answers gave the correct requested result but did not reproduce every supporting column in the verified output.
- Clear formulas do not prevent bad SQL. The return-rate definition was present, but Genie still created a cross join at the wrong grain.
- Ambiguity should be tested directly. Genie asked for clarification in two cases and silently selected a performance measure in the third.
- Important metrics need stronger controls. Verified SQL patterns, governed functions and recurring benchmarks can reduce dependence on a newly generated query each time.
If I continue this experiment, I would test a third round with one verified SQL example for the return-rate calculation, then rerun all seventeen questions. I would also add fiscal-calendar rules, customer hierarchies and questions that combine several metrics in one request.
For this test, the main result was clear. Business context changed Databricks Genie from an agent that matched none of the company-specific answers into one that returned the correct business result for thirteen of fourteen deterministic questions. The remaining SQL failure is exactly why the instructions and the benchmark both belong in the design.
This experiment was run on September 12, 2026. Databricks product behavior and benchmark scoring may change as Genie Agents are updated. For current product details, see Databricks official documentation: benchmark monitoring and Databricks official documentation: Genie Agent best practices.